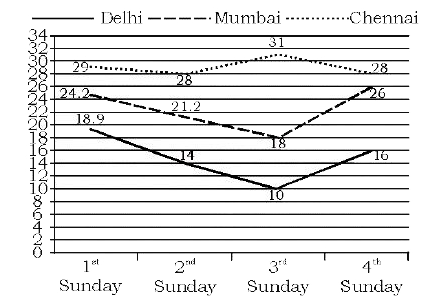
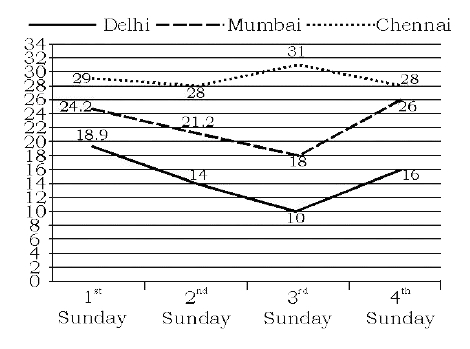
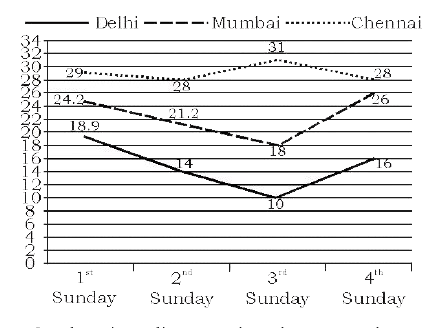
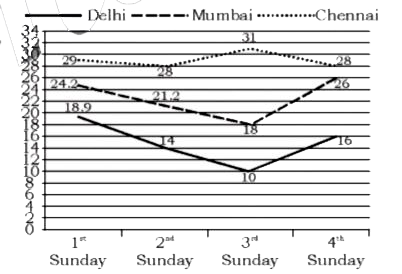
The line graph shows the temperature on four sundays of three cities

In the given line graph what was the difference in temperature between Delhi and Mumbai on the 2nd Sunday?
A. 21
B. 13
C. 17.2
D.7.2
The correct Answer is:D
Step by step video solution for The line graph shows the temperature on four sundays of three cities In the given line graph what was the difference in temperature between Delhi and Mumbai on the 2nd Sunday? by Maths experts to help you in doubts & scoring excellent marks in Class 14 exams.
Updated on:21/07/2023Topper's Solved these Questions
Similar Questions
Find the simple interest and compound interest on Rs 10000 for 2 years at the rate of 10%?
View SolutionIn triangle PQR, the internal bisector of ∠Q and ∠R meets at 0. If ∠QPR=70∘, then what is the value (in degrees) of ∠QOR?
View SolutionDetermine the point of symmetry of a regular hexagon.
View SolutionDtermine the images of the following figure about the given line :
View SolutionMatch the following Column A to Column B

View SolutionMatch the following Column A to Column B

View SolutionMatch the following Column A to Column B

View SolutionThe inequation represented by the graph given below is :
View SolutionThe inequation that best describes the graph given below is _________
View SolutionThe inequation that best describes the following graph is _________
View SolutionThe line graph shows the temperature on four Sundays of three cities
 In the given line graph , what was the average temperature on the 1st Sunday in all the three cities?
View SolutionThe line graph shows the temperature on four Sundays of three cities
 In the given line graph , when was the maximum temperature recorded in Chennai
View SolutionThe line graph shows the temperature on four Sunday of three cities In the given graph, what was the difference in temperature between Delhi and Chennai on the 3rd Sunday?
View SolutionThe line graph shows the temperature on four sundays of three cities In the given graph when was the maximum temperature recorded in delhi
View SolutionThe line graph shows the temperature on four sundays all three cities

In the given line graph, what was the average temperature on the 3rd Sunday in all the three citites
View SolutionThe following graph shows the temperatures of four Sundays in three cities. In the given graph, what was the difference in temperature between Delhi and Chennai on 3rd Sunday?
View Solution