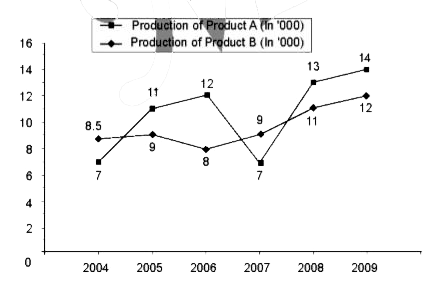
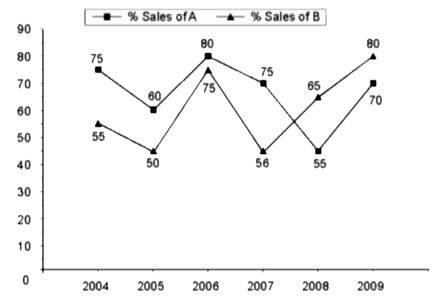
The line graph shows the production of product A and B during the period 2004 to 2009 and the second line graph shows the percentage sale of these products
 br>
br> 
In the given line graph, what is the total sale of products A in the year 2005 and 2009 taken together?
A. 10290
B. 13460
C. 11500
D. 16400
The correct Answer is:C
Step by step video solution for The line graph shows the production of product A and B during the period 2004 to 2009 and the second line graph shows the percentage sale of these products br> In the given line graph, what is the total sale of products A in the year 2005 and 2009 taken together? by Maths experts to help you in doubts & scoring excellent marks in Class 14 exams.
Updated on:21/07/2023Topper's Solved these Questions
Similar Questions
Find the simple interest and compound interest on Rs 10000 for 2 years at the rate of 10%?
View SolutionIn triangle PQR, the internal bisector of ∠Q and ∠R meets at 0. If ∠QPR=70∘, then what is the value (in degrees) of ∠QOR?
View SolutionHow many lines of symmetry does the above figure have ?
View SolutionDetermine the point of symmetry of a regular hexagon.
View SolutionDtermine the images of the following figure about the given line :
View SolutionMatch the following Column A to Column B

View SolutionMatch the following Column A to Column B

View SolutionMatch the following Column A to Column B

View SolutionThe inequation represented by the graph given below is :
View SolutionThe inequation that best describes the graph given below is _________
View SolutionThe inequation that best describes the following graph is _________
View SolutionWhich inequations represent the shaded region in the given figure
View SolutionWhich of the following statement is not correc for following straight line graph :-
ltimg src="https://d10lpgp6xz60nq.cloudfront.net/physics_images/ALN_PHY_R04_E01_015_Q01.png" width="80%"gt
View SolutionThe equation of straight line shown in figure is :
ltimg src="https://d10lpgp6xz60nq.cloudfront.net/physics_images/ALN_PHY_R04_E01_020_Q01.png" width="80%"gt
View SolutionThe total surface area of the given solid figure is _______________.

View SolutionWhich of the following statement is not correct for following straight line graph :-
ltimg src="https://d10lpgp6xz60nq.cloudfront.net/physics_images/ALN_PHY_R04_E01_015_Q01.png" width="80%"gt
View Solution