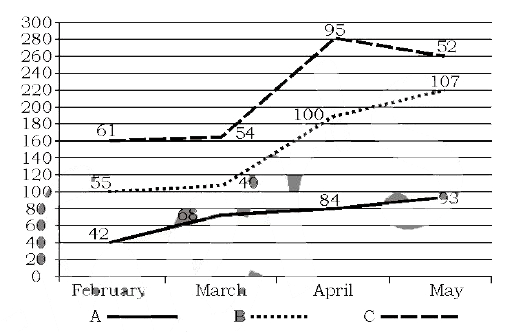
रेखा ग्राफ फरवरी से मई तक तीन घरो A, B और C के लिए बिजली की खपत (इकाइयो में) दिखाता है।

दी गई रेखा ग्राफ में, फरवरी और अप्रैल के महीनो के बीच कुल बिजली की खपत का अंतर है:
97
74
121
15
The correct Answer is:C
Step by step video & text solution for रेखा ग्राफ फरवरी से मई तक तीन घरो A, B और C के लिए बिजली की खपत (इकाइयो में) दिखाता है। दी गई रेखा ग्राफ में, फरवरी और अप्रैल के महीनो के बीच कुल बिजली की खपत का अंतर है: by Maths experts to help you in doubts & scoring excellent marks in Class 14 exams.
Updated on:21/07/2023टॉपर्स ने हल किए ये सवाल
समान प्रश्न
यदि A:B=2:3 और B:C=3:7, तो A+B:B+C:C+A क्या होगा?
View SolutionP और Q की वर्तमान आयु के बीच का क्रमशः अनुपात 3 : 4 है। चार वर्ष बाद Q, P से पाँच वर्ष बड़ा होगा।P की वर्तमान आयु कितनी है?
View SolutionDetermine the point of symmetry of a regular hexagon.
View SolutionMatch the following Column A to Column B

View SolutionMatch the following Column A to Column B

View SolutionMatch the following Column A to Column B

View SolutionThe inequation represented by the graph given below is :
View SolutionThe inequation that best describes the graph given below is _________
View SolutionThe inequation that best describes the following graph is _________
View Solutionउस सरल रेखा का समीकरण ज्ञात कीजिए जो मूलबिंदु से होकर जाती है और निर्देशाओं के बीच सरल रेखा 3x+y=12 के भाग को 1:2 के अनुपात में विभाजित करती है।
View Solutionएक सरल रेखा बिन्दु (-1,5) से होकर जाती है और रेखा द्वारा अक्षो के बीच काटे हुए भाग को यह बिन्दु 3:2 के अनुपात में विभाजित करता है। रेखा का समीकरण ज्ञात कीजिए|
View Solutionवृत्त की छेदन रेखा PQ है। छेदन रेखा PQ के स्पर्श रेखा बनने का प्रतिबन्ध किखिये।
View SolutionThe monthly incomes of Abhinav and Rekha are in the ratio of 6 : 5, while their monthly expenditures are in the ratio of 9 :8. If the income of Abhinav is twice the expenditure of Rekha, then what is the ratio between the savings of Abhinav and Rekha ?
अभिनव और रेखा की मासिक आय 6:5 के अनुपात में है, जबकि मासिक व्यय 9:8 के अनुपात में है | यदि अभिनव की आय, रेखा के व्यय से दोगुनी है, तब अभिनव और रेखा की बचत का अनुपात है:
View SolutionThe given table represents the number of computers sold by four dealers A,B, C and D during the first six months of 2016. Study the table carefully and answer the questions that follows: दी गयी तालिका चार विक्रेताओं A, B, C और D के द्वारा 2016 के पहले छः महीनों में बेचे गए कंप्यूटरों की संख्या दर्शाती है | इस तालिका का ध्यानपूर्वक अध्ययन करें तथा पूछे गए प्रश्नों का उत्तर दें | What is the ratio of the total number of computers sold by dealer A in February, April and May to the total number of computers sold by dealer D in March, May and June? / विक्रेता A के द्वारा फरवरी, अप्रैल और मई में बेचे गए कंप्यूटरों की कुल संख्या तथा विक्रेता D के द्वारा मार्च, मई और जून में बेचे गए कंप्यूटरों की कुल संख्या के बीच क्या अनुपात है ?
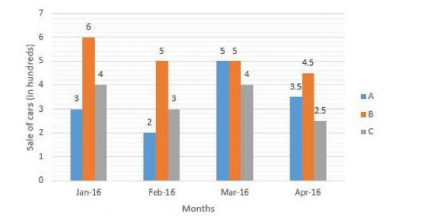
View SolutionThe given bar graph presents the sale of a particular brand of car by three showrooms, A, B and C( in multiples of 100) during the months of Jan, Feb, Mar and Apr, 2016
दिया गया दंड आरेख (बार ग्राफ) तीन शो-रूम- A, B और C के द्वारा जनवरी, फरवरी, मार्च और अप्रैल, 2016 के दौरान कार के एक खास ब्रांड की (100 के गुणक में) बिक्री को दर्शाता है| What is the ratio of the number of cars sold by A in Jan-Feb, 2016 to that of cars sold by B during Mar-Apr, 2016?
जनवरी-फरवरी, 2016 में A के द्वारा और मार्च-अप्रैल, 2016 के दौरान B के द्वारा बेची गई कारों की संख्या का अनुपात क्या है?
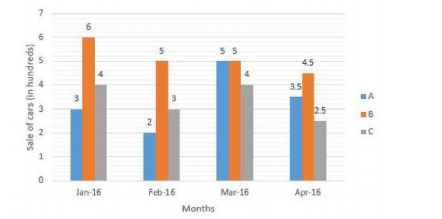
View SolutionThe given bar graph presents the sale of a particular brand of car by three showrooms, A, B and C( in multiples of 100) during the months of Jan, Feb, Mar and Apr, 2016
दिया गया दंड आरेख (बार ग्राफ) तीन शो-रूम- A, B और C के द्वारा जनवरी, फरवरी, मार्च और अप्रैल, 2016 के दौरान कार के एक खास ब्रांड की (100 के गुणक में) बिक्री को दर्शाता है| What was the average number of cars sold by A during Feb-Apr, 2016?
फरवरी-अप्रैल 2016 के दौरान, A के दवारा बेची गई कारों की औसत संख्या क्या थी?
View Solution