Which of the following graph is the best presentation for the given equation y=2ex


The correct Answer is:B
To determine which graph best represents the equation y=2ex, we can follow these steps:
Step 1: Understand the Equation
The given equation is y=2ex. This is an exponential function where e (approximately 2.71) is the base of the natural logarithm.
Step 2: Calculate Key Points
We can calculate the value of y for some specific values of x:
- For x=0:
y=2e0=2×1=2
- For x=1:
y=2e1=2×2.71≈5.42
- For x=2:
y=2e2=2×(2.712)≈2×7.39≈14.78
- For x=3:
y=2e3=2×(2.713)≈2×20.08≈40.16
Step 3: Analyze the Graphs
Now, we need to analyze the graphs provided (let's assume they are labeled A, B, C, and D):
1. Check the point at x=0: The graph should pass through the point (0, 2).
2. Check the growth of y: As x increases, y should also increase rapidly since it is an exponential function.
Step 4: Compare Graphs
- Graph A: At x=0, y=1 (incorrect).
- Graph B: At x=0, y=2 (correct) and appears to be increasing.
- Graph C: At x=0, y=1 (incorrect).
- Graph D: At x=0, y=2 (correct) but appears to be decreasing.
Step 5: Conclusion
Based on the analysis:
- Graph B is the best representation of the equation y=2ex because it correctly shows the point (0, 2) and the increasing nature of the function.
Final Answer
The best presentation for the equation y=2ex is Graph B.
The given equation is y=2ex. This is an exponential function where e (approximately 2.71) is the base of the natural logarithm.
We can calculate the value of y for some specific values of x:
- For x=0:
y=2e0=2×1=2
- For x=1:
y=2e1=2×2.71≈5.42
- For x=2:
y=2e2=2×(2.712)≈2×7.39≈14.78
- For x=3:
y=2e3=2×(2.713)≈2×20.08≈40.16
Now, we need to analyze the graphs provided (let's assume they are labeled A, B, C, and D):
1. Check the point at x=0: The graph should pass through the point (0, 2).
2. Check the growth of y: As x increases, y should also increase rapidly since it is an exponential function.
- Graph A: At x=0, y=1 (incorrect).
- Graph B: At x=0, y=2 (correct) and appears to be increasing.
- Graph C: At x=0, y=1 (incorrect).
- Graph D: At x=0, y=2 (correct) but appears to be decreasing.
Based on the analysis:
- Graph B is the best representation of the equation y=2ex because it correctly shows the point (0, 2) and the increasing nature of the function.
The best presentation for the equation y=2ex is Graph B.
Topper's Solved these Questions
- RACEBOOK - ALLENCHAPTER - RACEEXERCISE - Basic Maths (Co-ordinate & Algebra)
37 Videos
- RACEBOOK - ALLENCHAPTER - RACEEXERCISE - Basic Maths (VECTORS)
60 Videos
- RACEBOOK - ALLENCHAPTER - RACEEXERCISE - Basic Maths (Integration)
12 Videos
- NEWTONS LAWS OF MOTIONBOOK - ALLENCHAPTER - NEWTONS LAWS OF MOTIONEXERCISE - EXERCISE-III
28 Videos
- SIMPLE HARMONIC MOTIONBOOK - ALLENCHAPTER - SIMPLE HARMONIC MOTIONEXERCISE - Example
1 Video
Similar Questions
Find the value of :-
(i)√4
(ii)√9
(iii)√16
(iv)sqrt(36)
View SolutionRatio of amplitude for two wave is 3:7 .Find the ratio of intensity?
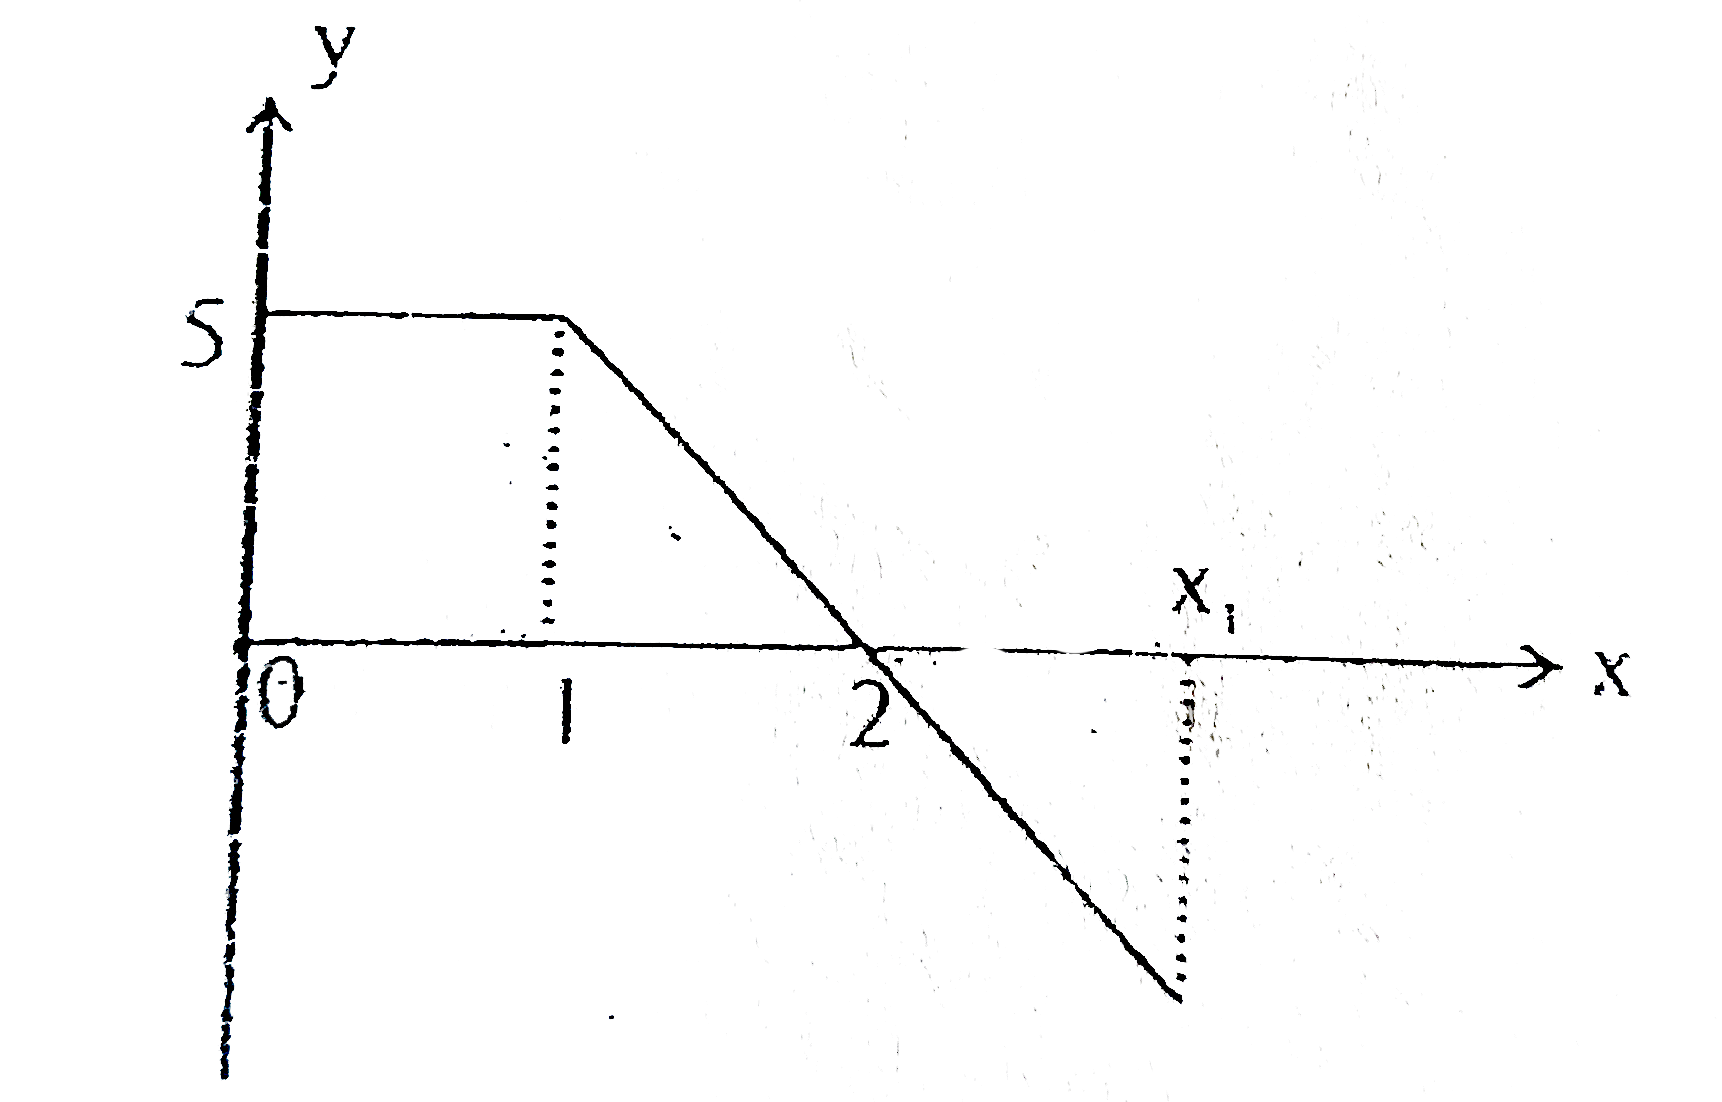
View SolutionFind the value of x1, so that ∫x10ydx=5

View SolutionAssertion: The driver in a vechicle moving with a constant speed on a straight road is in a non-inertial frame of referance.
Reason: A reference frame in which Newton's laws of motion are applicable is non-inertial.
View SolutionA disc is made to oscillate about a horizontal axis passing through one of its ends and its behaves like a second's pendulum. Determine its lengths.
View SolutionGiven the graph of y=f(x), which of the following is graph of y=f(1-x)
View SolutionIn the given figure is shown a variable y varying exponentially on another variable x. Study the graph carafully. Which of the following equations best suits the show graph?
View Solutionअवकल समीकरणों को हल कीजिये
(1+2ex/y)dx+2ex/y(1−xy)dy=0
View SolutionSolve the following differential equations.
dydx−y=−2e−x
View Solution
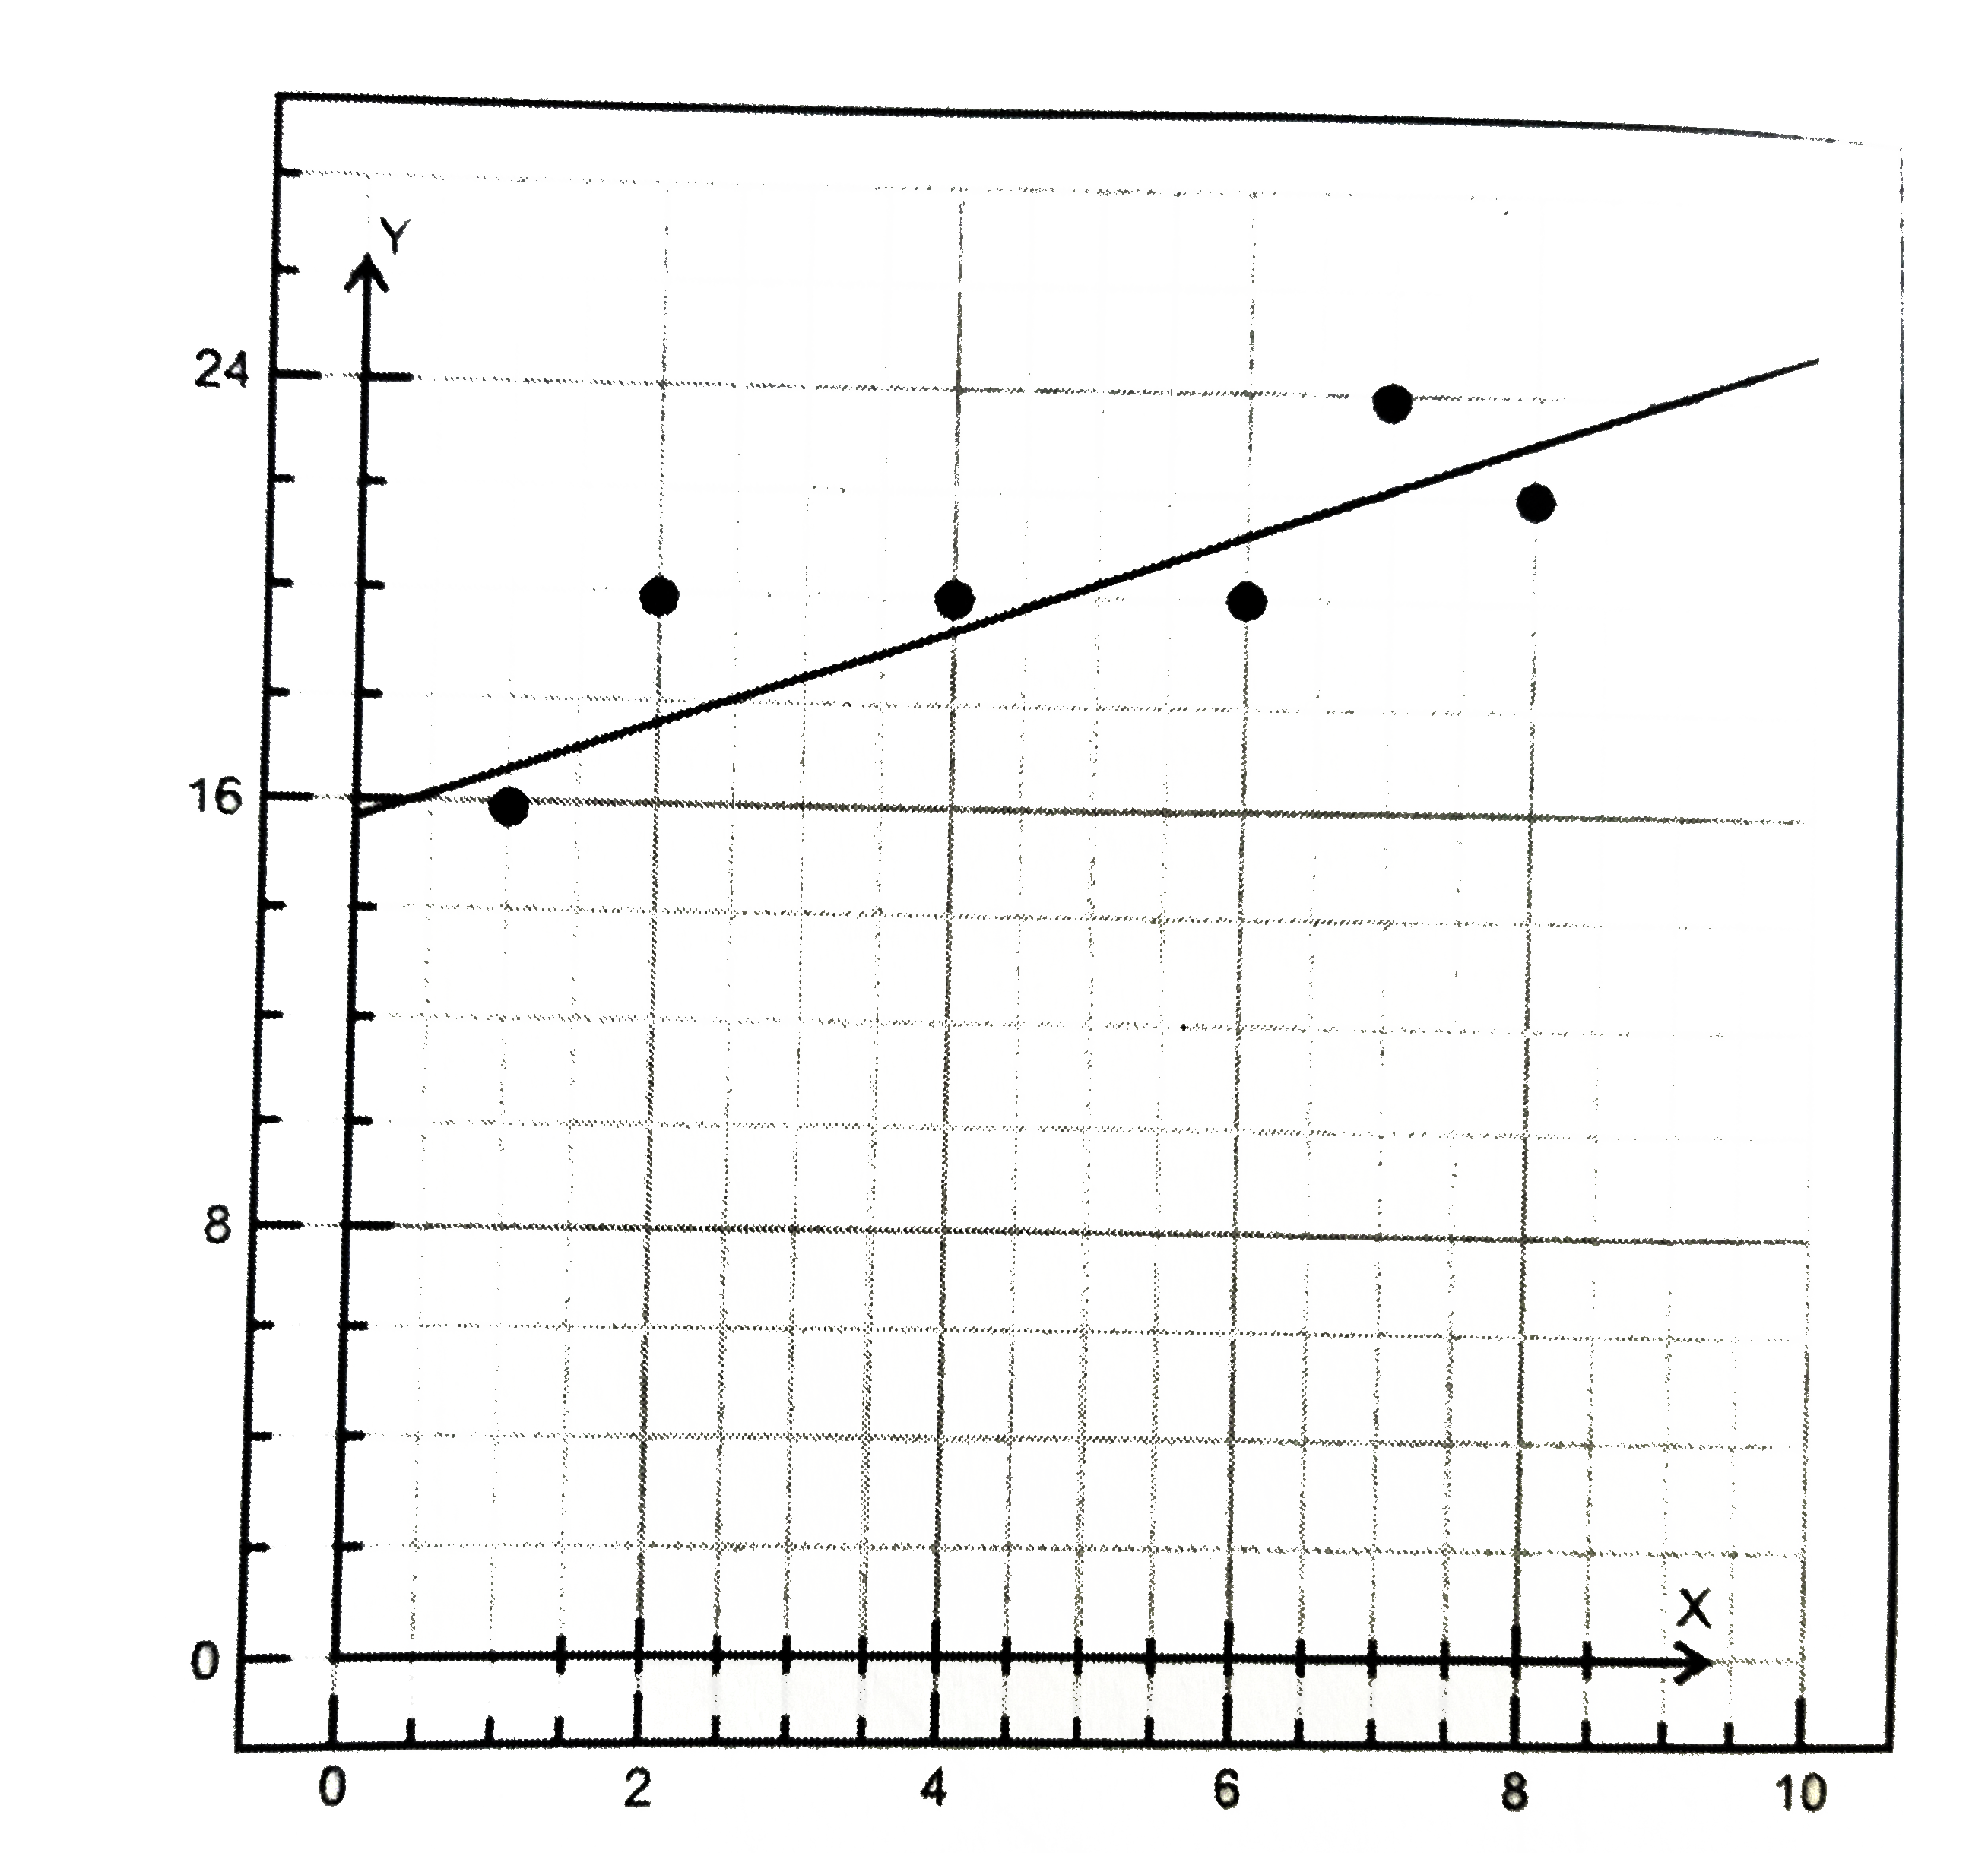
In a experiment a set of points denoted by the (x,y) coordinates are shown in the graph above along with the line of best fit. Which of the following is the best equation for the above line ?
View SolutionWhich one of following best represents the graph of y=xlogxπ
View SolutionGraph the given equation - x + y = 4
View SolutionGraph the given equation - x - y = 2
View SolutionGraph the given equation - 3 x + y = 7
View SolutionGraph the given equation - y = 4 x
View SolutionSolve the following differential equations. (1+2exy)dx+2exy(1−xy)dy=0
View Solution

