The bar-graph given below shows the percentage distribution of total expenditures of a company under various expense heads during 2013. Study the graph and answer the given questions.
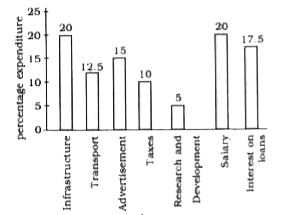
The expenditure on the interest on loans is what percent more than the expenditure on transport ?
5%
10%
20%
40%
The correct Answer is:D
Step by step video solution for The bar-graph given below shows the percentage distribution of total expenditures of a company under various expense heads during 2013. Study the graph and answer the given questions. The expenditure on the interest on loans is what percent more than the expenditure on transport ? by Maths experts to help you in doubts & scoring excellent marks in Class 14 exams.
Updated on:21/07/2023Topper's Solved these Questions
- STATISTICS AND DATA INTERPRETATIONBOOK - KIRAN PUBLICATIONCHAPTER - STATISTICS AND DATA INTERPRETATIONEXERCISE - TYPE-III
39 Videos
- STATISTICS AND DATA INTERPRETATIONBOOK - KIRAN PUBLICATIONCHAPTER - STATISTICS AND DATA INTERPRETATIONEXERCISE - TYPE-IV
182 Videos
- STATISTICS AND DATA INTERPRETATIONBOOK - KIRAN PUBLICATIONCHAPTER - STATISTICS AND DATA INTERPRETATIONEXERCISE - TYPE-VIII
8 Videos
- SIMPLIFICATIONBOOK - KIRAN PUBLICATIONCHAPTER - SIMPLIFICATIONEXERCISE - TEST YOURSELF
25 Videos
- TIME AND DISTANCEBOOK - KIRAN PUBLICATIONCHAPTER - TIME AND DISTANCEEXERCISE - Type -XI
74 Videos
Similar Questions
The following is a horizontal bar diagram showing the accidents in which two-wheelers are involved with other objects. Study the diagram and answer the questions.
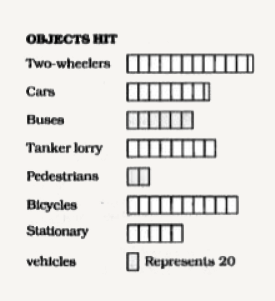
The difference in percentage between the accidents involving two-wheeler and other objects is respectively.
View SolutionThe following questions are based on the bar graph. Read the graph and answer the questions.
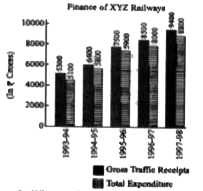
What is the percentage increase in the grass traffic receipts in 1995-96 as compared to 1993-94?
View SolutionStudy the following frequency polygon and answer the questions.
Given a line graph showing the number of students passed in Higher Secondary Examination in a school over the years 2008 to 2013.
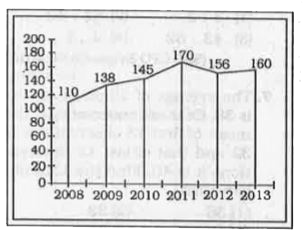
The average of passed students in the years 2008, 2009, 2012 approximately is
View SolutionSimplify : 1+11+22+31+45
View SolutionI walk a certain distance and ride back taking a total time of 37 minutes. I could walk both ways in 55 minutes. How long would it take me to ride both ways?
View Solutionग्राफ में किसी कम्पनी के मासिक व्यय को दर्शाया गया है। ग्राफ का अध्ययन कीजिए और निम्नलित प्रश्नों के उत्तर दीजिए ?
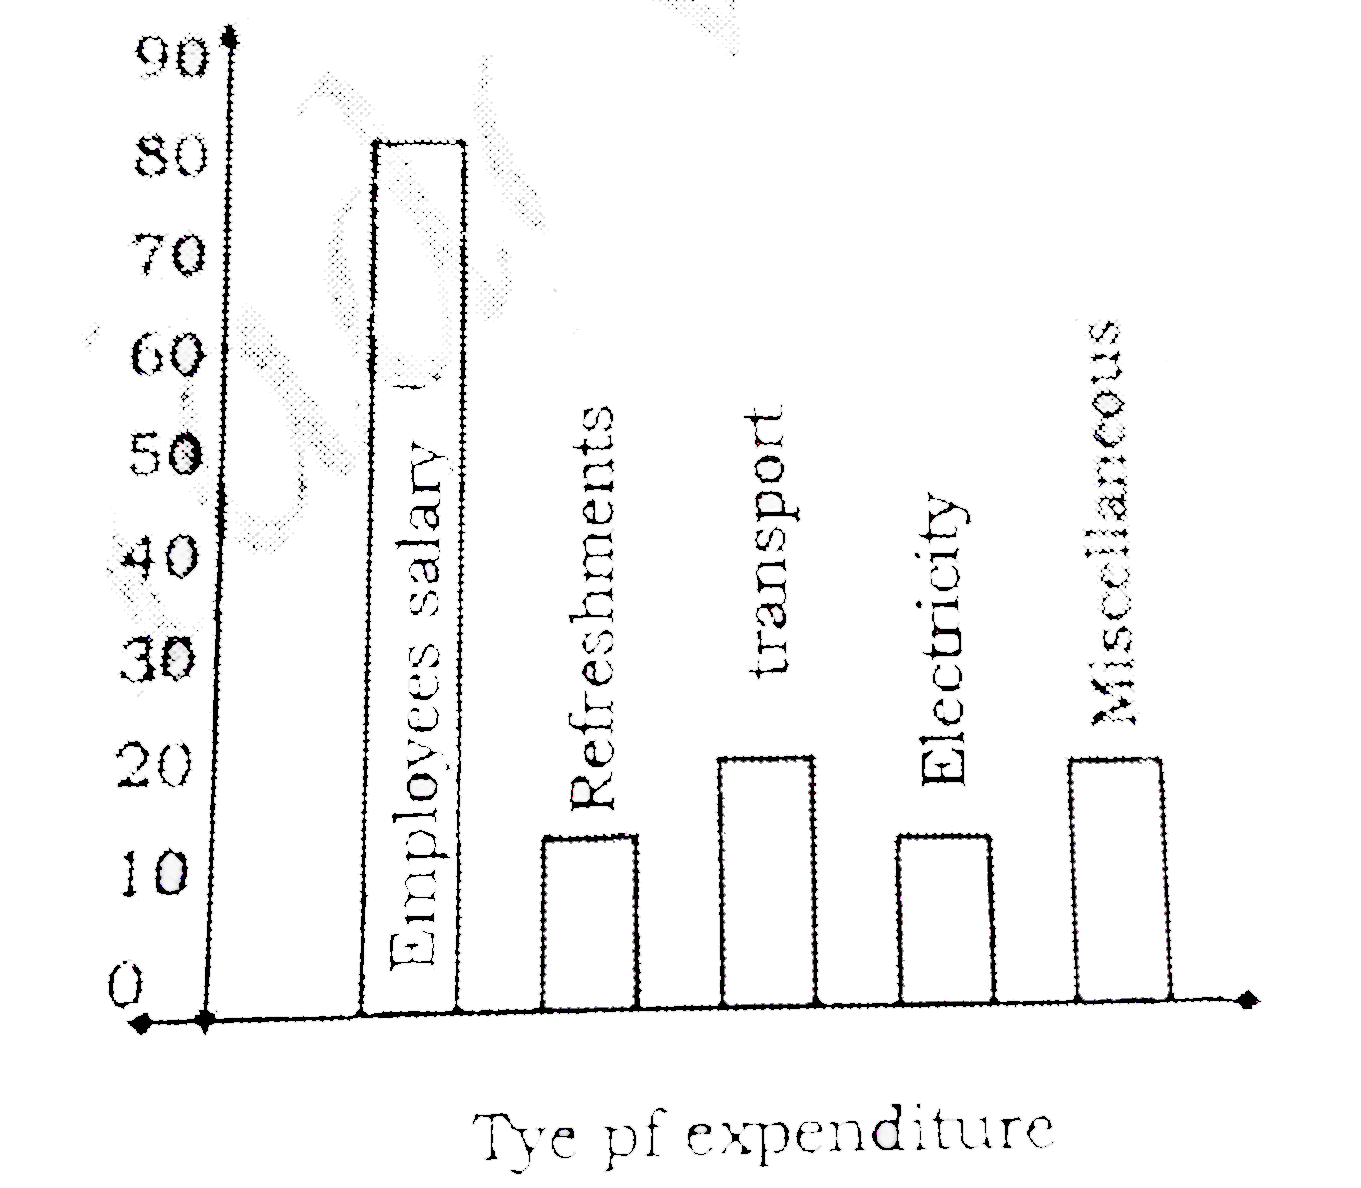
कम्पनी का कुल मासिक व्यय कितना है ?
View SolutionMatch the following Column A to Column B

View SolutionThe inequation represented by the graph given below is :
View SolutionThe inequation that best describes the graph given below is _________
View SolutionThe inequation that best describes the following graph is _________
View SolutionThe bar diagram shows the monthly expenditure of a company. Study the graph and answer the questions.
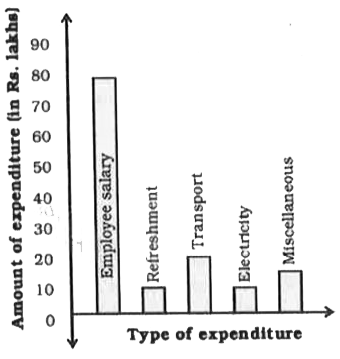
The total monthly expenditure of the company is :
View SolutionStudy the following graph and answer the question. Percentage distribution of total expenditure of a company in 2012 What is the ratio of the total expenditure on salary and interest on loan to the total expenditure on infrastructure and transport?
View SolutionThe bar-graph given below shows the percentage distribution of total expenditures of a company under various expense heads during 2013. Study the graph and answer the given questions. The ratio of the total expenditure on infrastructure and transport to the total expenditure on taxes and interest on loans is
View SolutionThe bar-graph given below shows the percentage distribution of total expenditures of a company under various expense heads during 2013. Study the graph and answer the given questions. If the expenditure on advertisement is Rs 2.10 crores, then the difference between the expenditure on transport and taxes is
View SolutionThe bar-graph given below shows the percentage distribution of total expenditures of a company under various expense heads during 2013. Study the graph and answer the given questions. If the total ammount of expenditure of the company in N times the expenditure on reach and development, then the value of N is
View Solution
