The sub-divided bar diagram given below depicts the result of B.Com. Students of a college for 3 years. Study the graph and answer the given questions.
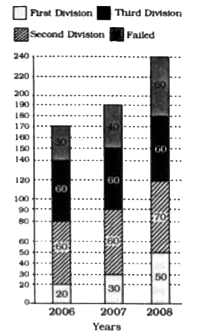
How many percent of students passed in first division in 2007?
151519%
111317%
1623%
1212%
The correct Answer is:A
Step by step video solution for The sub-divided bar diagram given below depicts the result of B.Com. Students of a college for 3 years. Study the graph and answer the given questions. How many percent of students passed in first division in 2007? by Maths experts to help you in doubts & scoring excellent marks in Class 14 exams.
Updated on:21/07/2023Topper's Solved these Questions
- STATISTICS AND DATA INTERPRETATIONBOOK - KIRAN PUBLICATIONCHAPTER - STATISTICS AND DATA INTERPRETATIONEXERCISE - TYPE-IV
182 Videos
- STATISTICS AND DATA INTERPRETATIONBOOK - KIRAN PUBLICATIONCHAPTER - STATISTICS AND DATA INTERPRETATIONEXERCISE - TYPE-V
38 Videos
- STATISTICS AND DATA INTERPRETATIONBOOK - KIRAN PUBLICATIONCHAPTER - STATISTICS AND DATA INTERPRETATIONEXERCISE - TYPE-II
131 Videos
- SIMPLIFICATIONBOOK - KIRAN PUBLICATIONCHAPTER - SIMPLIFICATIONEXERCISE - TEST YOURSELF
25 Videos
- TIME AND DISTANCEBOOK - KIRAN PUBLICATIONCHAPTER - TIME AND DISTANCEEXERCISE - Type -XI
74 Videos
Similar Questions
The following questions are based on the bar graph. Read the graph and answer the questions.
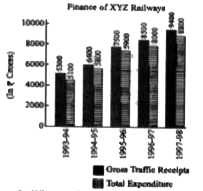
What is the percentage increase in the grass traffic receipts in 1995-96 as compared to 1993-94?
View SolutionThe histogram shows the maeks obtained by 45 students of a class. Look at the histogram and answer the questions.
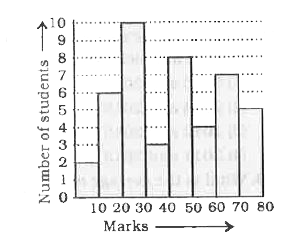
How many students have obtained marks 50 and above ?
View SolutionThe Bar Graph given here shows the population (in crores) of India in various census years. Observe the graph and answer the question based on it.
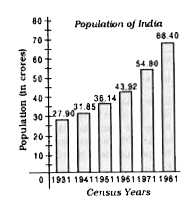
The per cent increase in population from 1971 to 1982 is
View SolutionSimplify : 1+11+22+31+45
View SolutionI walk a certain distance and ride back taking a total time of 37 minutes. I could walk both ways in 55 minutes. How long would it take me to ride both ways?
View SolutionThe subdivided bar diagram given below depicts the result of B com students of a college for 3 years Study the graph and answer the given questions
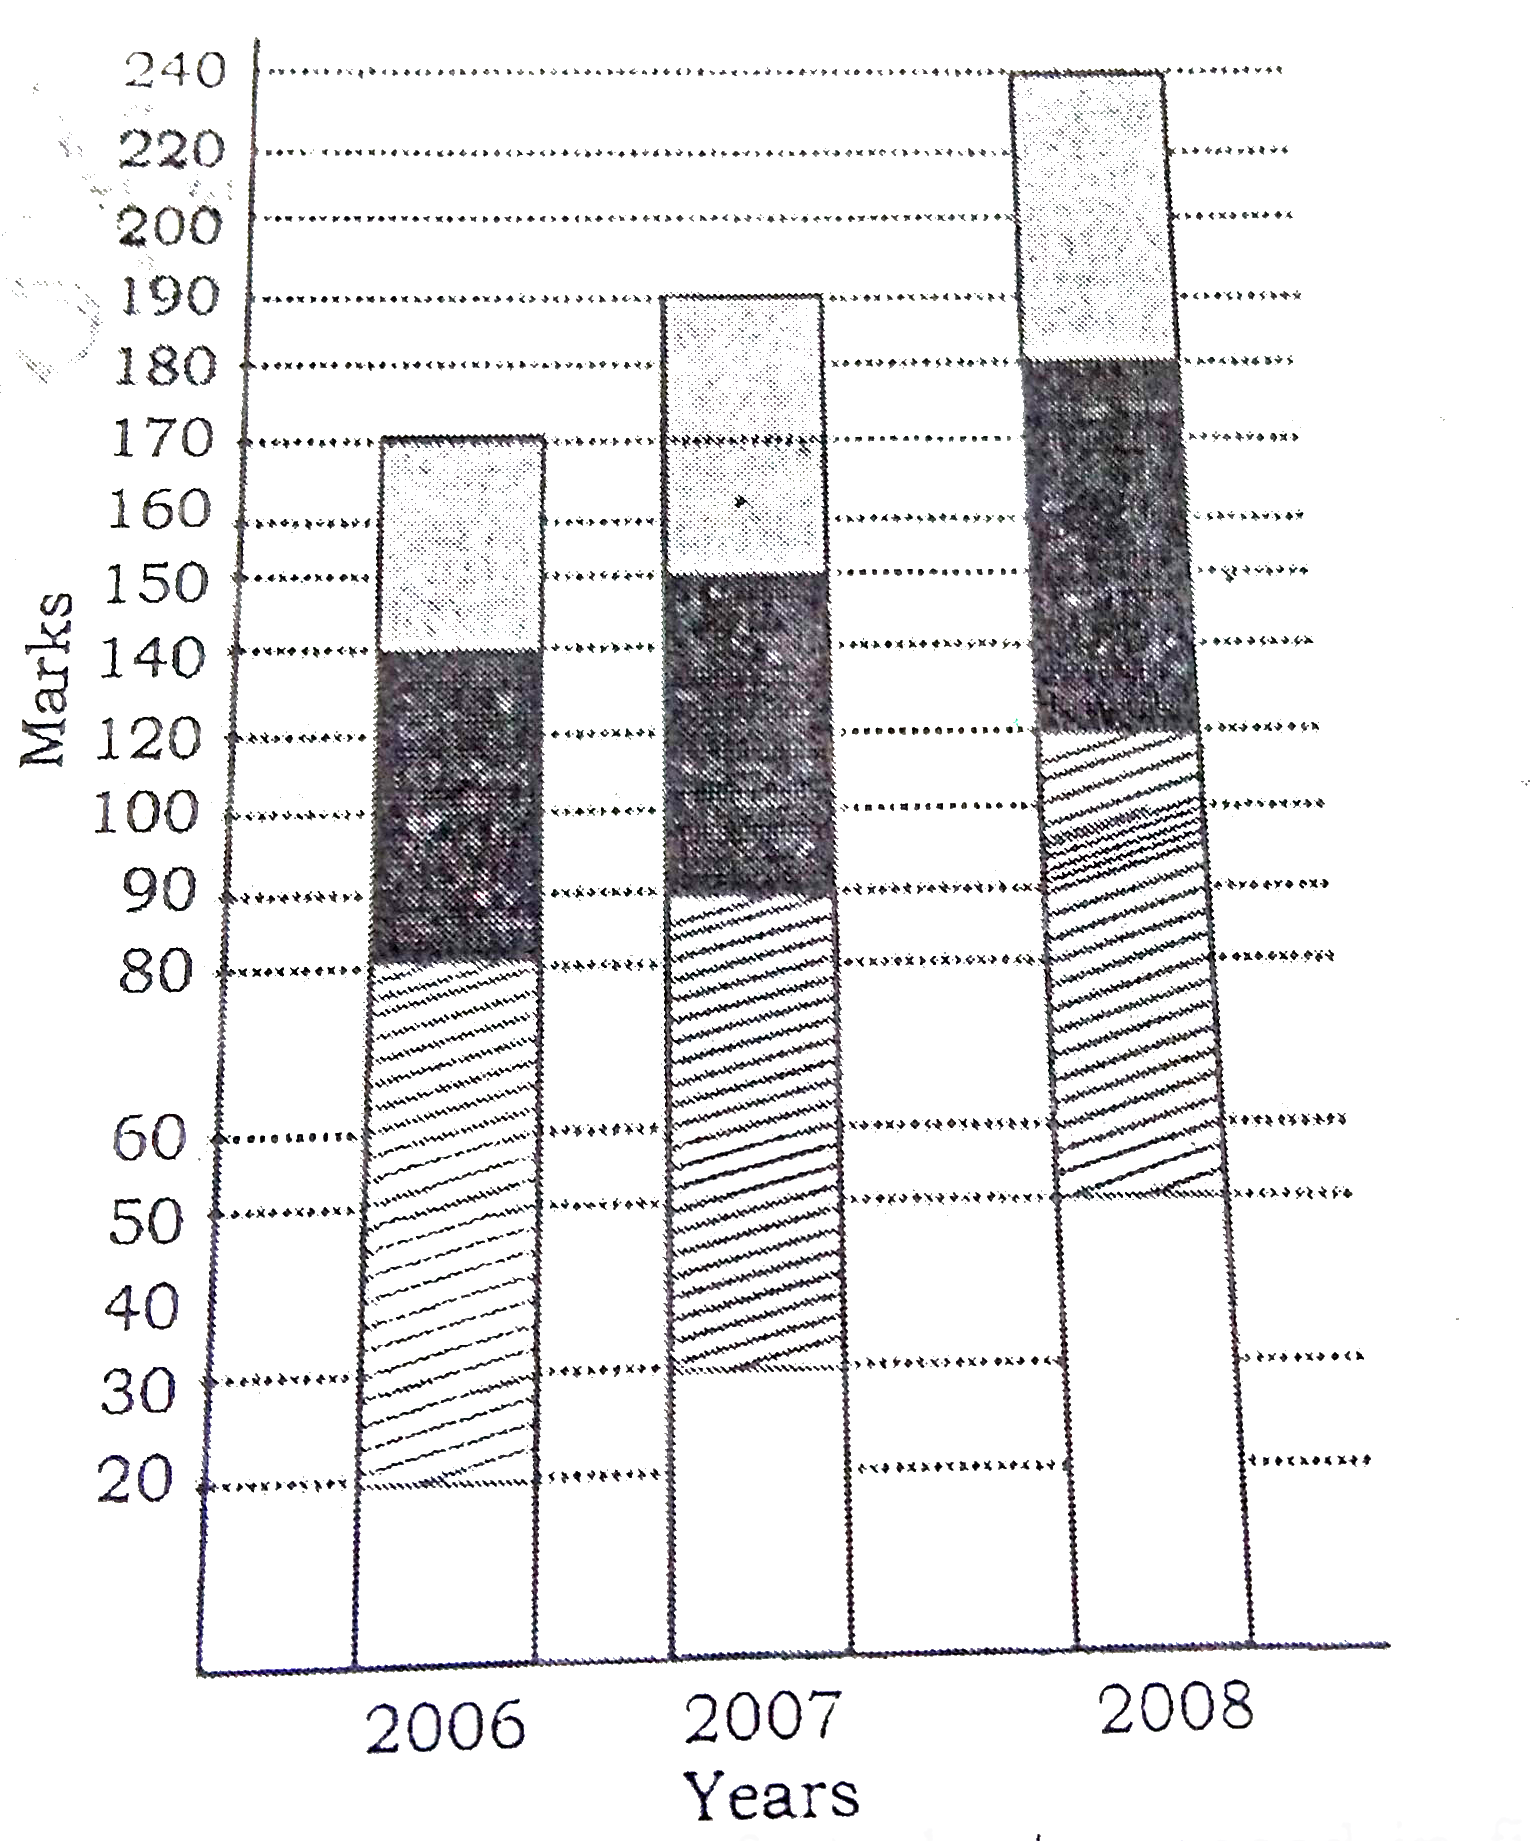
वर्ष 2007 में प्रथम श्रेणी में पास होने वाले छात्रों का % बताये ।
View SolutionDetermine the point of symmetry of a regular hexagon.
View SolutionMatch the following Column A to Column B

View SolutionMatch the following Column A to Column B

View SolutionMatch the following Column A to Column B

View SolutionFind the area of figure given below.

View SolutionFind the perimeter of the figure given below.

View SolutionFind the area of the figure given below.

View SolutionThe inequation represented by the graph given below is :
View SolutionThe inequation that best describes the graph given below is _________
View Solution
