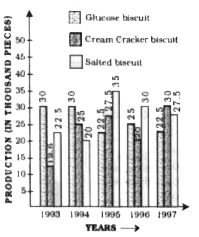
The bar diagram given below shows the productions (in the unit of thousand pieces) of three types of biscuits by a company in the five consecutive years. Study the diagram and answer the following questions.
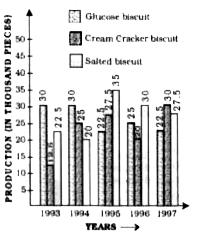
Total production of all the three types of biscuits was the least in the year
1993
1997
1996
1995
The correct Answer is:A
Step by step video & text solution for The bar diagram given below shows the productions (in the unit of thousand pieces) of three types of biscuits by a company in the five consecutive years. Study the diagram and answer the following questions. Total production of all the three types of biscuits was the least in the year by Maths experts to help you in doubts & scoring excellent marks in Class 14 exams.
Updated on:21/07/2023Topper's Solved these Questions
- STATISTICS AND DATA INTERPRETATIONBOOK - KIRAN PUBLICATIONCHAPTER - STATISTICS AND DATA INTERPRETATIONEXERCISE - TYPE-V
38 Videos
- STATISTICS AND DATA INTERPRETATIONBOOK - KIRAN PUBLICATIONCHAPTER - STATISTICS AND DATA INTERPRETATIONEXERCISE - TYPE-VI
86 Videos
- STATISTICS AND DATA INTERPRETATIONBOOK - KIRAN PUBLICATIONCHAPTER - STATISTICS AND DATA INTERPRETATIONEXERCISE - TYPE-III
39 Videos
- SIMPLIFICATIONBOOK - KIRAN PUBLICATIONCHAPTER - SIMPLIFICATIONEXERCISE - TEST YOURSELF
25 Videos
- TIME AND DISTANCEBOOK - KIRAN PUBLICATIONCHAPTER - TIME AND DISTANCEEXERCISE - Type -XI
74 Videos
Similar Questions
The histogram shows the maeks obtained by 45 students of a class. Look at the histogram and answer the questions.
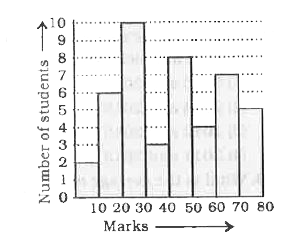
How many students have obtained marks 50 and above ?
View SolutionThe graph given here shows the annual premiums of an insurance company, charged for an insurance of Rs for individuals of different age-groups. Study the graph and answer each of the following questions : Scale{along O X −−−−−−−−−−−−−−−−−−−−−−−−−−−−−−−−→ 1 small div = 1 yearalong O Y −−−−−−−−−−−−−−−−−−−−−−−−−−−−−−−−→ 1 small div = 50 paise
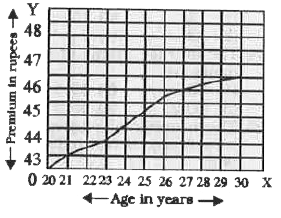
The annual premium for a man aged 26 years for an insurance of Rs 1000 is
View SolutionThe following is a horizontal bar diagram showing the accidents in which two-wheelers are involved with other objects. Study the diagram and answer the questions.
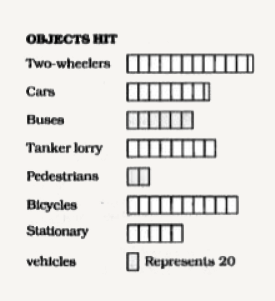
The difference in percentage between the accidents involving two-wheeler and other objects is respectively.
View SolutionSimplify : 1+11+22+31+45
View SolutionI walk a certain distance and ride back taking a total time of 37 minutes. I could walk both ways in 55 minutes. How long would it take me to ride both ways?
View SolutionDetermine the point of symmetry of a regular hexagon.
View SolutionMatch the following Column A to Column B

View SolutionMatch the following Column A to Column B

View SolutionThe inequation represented by the graph given below is :
View SolutionThe inequation that best describes the graph given below is _________
View SolutionThe inequation that best describes the following graph is _________
View SolutionThe bar diagram given below shows the productions (in the unit of thousand pieces) of three types of biscuits by a company in the five consecutive years. Study the diagram and answer the following questions.
The percentage drop in the number of glucose biscuits manufactured from 1994 t 1995 is
View SolutionThe bar diagram given below shows the productions (in the unit of thousand pieces) of three types of biscuits by a company in the five consecutive years. Study the diagram and answer the following questions.
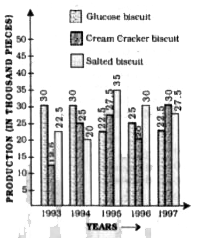
The difference (in the unit of thousand pieces) between the total number of cream cracker biscuits manufactured in the years 1993, 1995 and 1997 and hte total number of the biscuits of same type in the years 1994 and 1996 is
View SolutionThe bar diagram given below shows the productions (in the unit of thousand pieces) of three types of biscuits by a company in the five consecutive years. Study the diagram and answer the following questions.
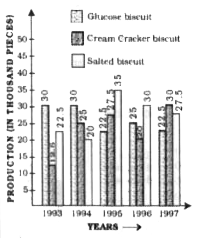
The production of all the three types of biscuits was maximum in the year
View SolutionThe bar diagram given below shows the productions (in the unit of thousand pieces) of three types of biscuits by a company in the five consecutive years. Study the diagram and answer the following questions.
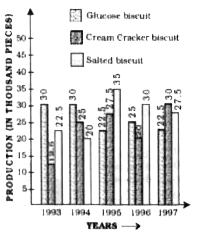
The ratio of production of glucose biscuits and total production of biscuits in that year was maximum in
View Solution
