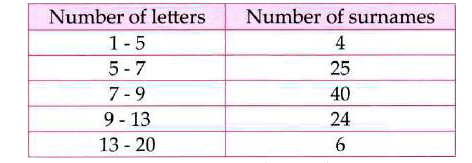
100 surnames were randomly picked up for a test and fequency distribution of the number of letters in the English alphabet in the surnames was found as follows :

Draw a histogram to depict the given information
The correct Answer is:(##MTGFOUCOUMATIXC14E02088_A01##)
Step by step video & text solution for 100 surnames were randomly picked up for a test and fequency distribution of the number of letters in the English alphabet in the surnames was found as follows : Draw a histogram to depict the given information by Maths experts to help you in doubts & scoring excellent marks in Class 9 exams.
Updated on:21/07/2023Topper's Solved these Questions
- STATISTICSBOOK - MTG IIT JEE FOUNDATIONCHAPTER - STATISTICSEXERCISE - Exercise ( Integer/Numerical Value Type )
10 Videos
- STATISTICSBOOK - MTG IIT JEE FOUNDATIONCHAPTER - STATISTICSEXERCISE - Olympiad/HOTS Corner
20 Videos
- STATISTICSBOOK - MTG IIT JEE FOUNDATIONCHAPTER - STATISTICSEXERCISE - Exercise ( Subjective Problems ) ( Short Answer Type )
10 Videos
- QUADRILATERALS BOOK - MTG IIT JEE FOUNDATIONCHAPTER - QUADRILATERALS EXERCISE - Olympiad/HOTS CORNER
15 Videos
- TRIANGLESBOOK - MTG IIT JEE FOUNDATIONCHAPTER - TRIANGLESEXERCISE - OLYMPAID/ HOTS CORNER
10 Videos
Similar Questions
If the mean of a, b, c, d and e is 28, mean of a, c and e is 24 and mean of b and d is n2 - 2, then the value of n is ± k, where k is
View SolutionThe weight (in kg) of 50 students are given below
40 45 55 62 50 51 56 69 61 36
60 56 69 38 35 63 57 50 57 48
40 63 53 64 47 42 56 51 42 60
55 39 64 57 64 44 66 35 59 59
73 62 49 63 37 63 54 72 44 60
Find the mean, median and mode respectively for the given data.
View SolutionThe runs scored by players of a cricket team are as follows:
57, 17, 26, 91, 115, 26, 83, 41, 57, 0, 26
Find their mean, median and mode.
View SolutionThe length of the parallel sides of a trapezium are 14 cm and 7 cm. If the perpendicular distance between them is 8 cm, then the area of the trapezium is:
View SolutionIf ΔABC is an obtuse angled triangle in which ∠C=110∘ then which one of the following is true ?
View Solution100 surnames were randomly picked up from a local telephone directory and a frequency distribution of the number of letters in the English alphabet in the surnames was found as follows:
(i) Draw a histogram
(ii) write the class interval in which maximum number of surnames lie .

View Solution100 surnames were randomly picked up from a local telephone directory and a frequency distribution of the number of letter in English alphabet in the surnames was found as follows:

(i) Draw a histogram to depict the given information.
(ii) Write the class interval in which the maximum number of surnames lie.
View SolutionMatch the following Column A to Column B

View SolutionThe inequation represented by the graph given below is :
View SolutionThe inequation that best describes the graph given below is _________
View Solution100 surnames were randomly randomly picked up from a local telephone directory and a frequency distribution of the number of letters in the English alphabet in the surnames was found as follows :

(i) Draw a histogram to depict the given information.
View Solution100 surnames ware randomly picked up from a local telephone directory and the frequency distribution of the number of letters in the English alphabets in the surnames was obtained as follows :
Determine the median number of letters in the surnames.

View SolutionFind the mode of the given data 8,5,4,6,7,4,4,3,5,4,5,4,4,4,3
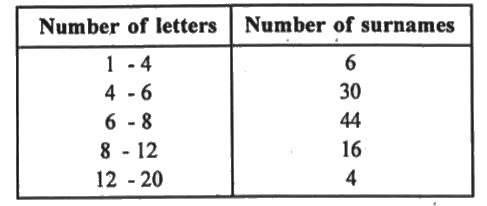
View Solution100 surnames were randomly picked up from a local telephone directory and the frequency distribution of the number of letters in the English alphabet in the surnames was obtained as follows

Determine the median number of letters in the surnames . Find the mean number of letters in the surnames ? Also, find the modal size of the surnames.
View Solution100 surnames were randomly picked up from a local telephone directory and the frequency distribution of the number of letters in the English alphabets in the surnames was obtained as follows:

Determine the median number of letters in the surnames. Find the mean number of letters in the surnames? Also, find the model size of the surnames.
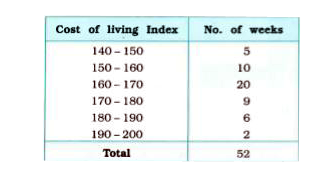
View SolutionIn a city, the weekly observations made in a study on the cost of living index are given in the following table :

Draw a frequency polygon for the data above (without constructing a histogram).
View Solution
