The pictograph shows the number of bicycles made by a factory during the four weeks of a month. Answer the following questions.
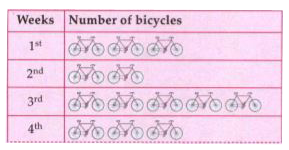

In which week maximum number of bicycles were made ?
Step by step video solution for The pictograph shows the number of bicycles made by a factory during the four weeks of a month. Answer the following questions. In which week maximum number of bicycles were made ? by Maths experts to help you in doubts & scoring excellent marks in Class 6 exams.
Updated on:21/07/2023Topper's Solved these Questions
- DATA HANDLING BOOK - MTG IIT JEE FOUNDATIONCHAPTER - DATA HANDLING EXERCISE - Solved Examples
37 Videos
- DATA HANDLING BOOK - MTG IIT JEE FOUNDATIONCHAPTER - DATA HANDLING EXERCISE - NCERT Section (Exercise 9.1)
22 Videos
- BASIC GEOMETRICAL IDEASBOOK - MTG IIT JEE FOUNDATIONCHAPTER - BASIC GEOMETRICAL IDEASEXERCISE - OLYMPIAD/HOTS CORNER
10 Videos
- DECIMALSBOOK - MTG IIT JEE FOUNDATIONCHAPTER - DECIMALSEXERCISE - OLYMPIAD/HOTS CORNER
20 Videos
Similar Questions
The pictograph shows the number of bicycles made by a factory during the four weeks of a month. Answer the following questions.
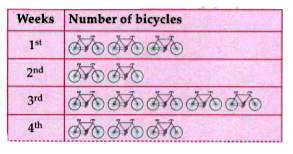

What is the difference between the number of bicycles made during 3rd week and 4th week ?
View SolutionThe pictograph shows the number of bicycles made by a factory during the four weeks of a month. Answer the following questions.
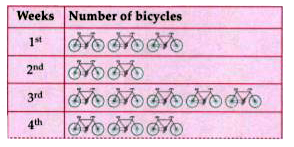

How many bicycles were made by the factory during 1st week ?
View Solution
Knowledge Check
Study the table carefully to answer the following questions ----
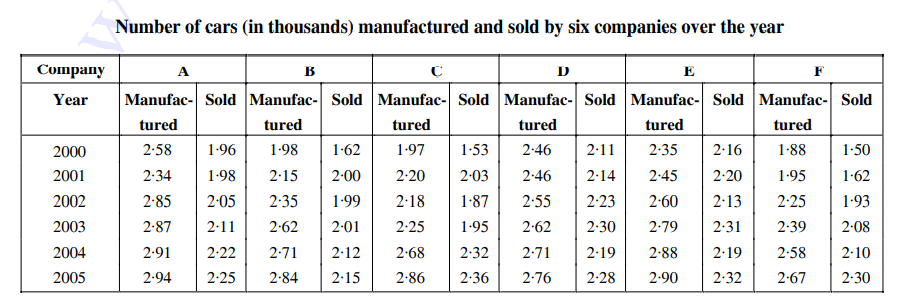
In which year were the maximum number of cars manufactured by all companies together ?A2001B2002C2003DNone of these
Look at the bar graph and answer the following questions.
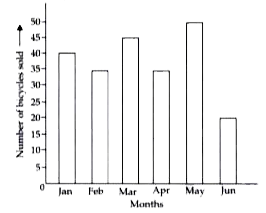
In which month 40 bicycles were sold?
View SolutionGiven here is a bar graph showing the number of cycles produced in a factory during five consecutive weeks.
Observe the graph and answer the questions based on this graph.
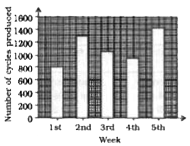
The number of cycles produced in the 5th week is
View SolutionFollowing pictograph shows the number of tractors in five villages.

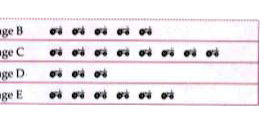
Observe the pictograph and answer the following questions.
Which village has the maximum number of tractors.
View SolutionThe bar graph shows the number of toys produced by a factory during a certain week.
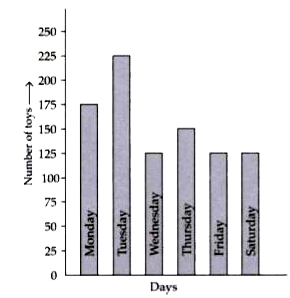
What is the total number of toys produced during the week ?
View SolutionFollowing pictograph shows the number of tractors in five villages.

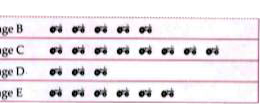
Observe the pictograph and answer the following questions.
Which village has the minimum number of tractors ?
View SolutionThe bar-chart is showing the number of accidents in a city during the first six month of a year. Examine the bar chart and answer the following questions.
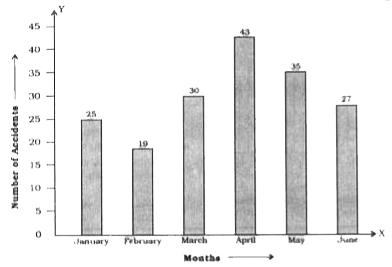
By what number, is the number of accidents that occurred in April is greater than the average number of accidents that occured during the 6 months period ?
View SolutionThe following pictograph shows the number of absentees in aclass of 30 students during the previous week

(a) On which day were the maximum number of students absent?
(b) Which day had full attendance?
(c) What was the total number of absentees in that week?
View Solution
