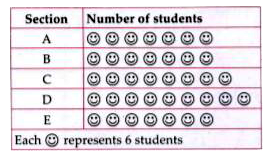
The given pictograph represents the number of students in 5 sections of class VI.

Study the given pictograph and answer the following questions.
How may students are there in section E ?
The correct Answer is:42
Step by step video solution for The given pictograph represents the number of students in 5 sections of class VI. Study the given pictograph and answer the following questions. How may students are there in section E ? by Maths experts to help you in doubts & scoring excellent marks in Class 6 exams.
Updated on:21/07/2023Topper's Solved these Questions
- DATA HANDLING Book:MTG IIT JEE FOUNDATIONChapter:DATA HANDLING Exercise:NCERT Section (Exercise 9.1)
Explore 22 Videos
- DATA HANDLING Book:MTG IIT JEE FOUNDATIONChapter:DATA HANDLING Exercise:NCERT Section (Exercise 9.2)
Explore 5 Videos
- DATA HANDLING Book:MTG IIT JEE FOUNDATIONChapter:DATA HANDLING Exercise:Olympiad/HOTS Corner
Explore 10 Videos
- BASIC GEOMETRICAL IDEASBook:MTG IIT JEE FOUNDATIONChapter:BASIC GEOMETRICAL IDEASExercise:OLYMPIAD/HOTS CORNER
Explore 10 Videos
- DECIMALSBook:MTG IIT JEE FOUNDATIONChapter:DECIMALSExercise:OLYMPIAD/HOTS CORNER
Explore 20 Videos
Similar Questions
In a Mathematics test, the following marks were obtained by 40 students. Arrange these marks in a table using tally marks.

View SolutionTotal number of animals in five villages are as follows :
Village A : 80Village B : 120Village C : 90Village D : 40Village E : 60
Prepare a pictograph of these animals using one symbol to represent to animals and answer the following questions :
How many symbols represent animals of village E ?
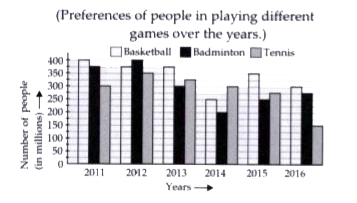
View SolutionStudy the bar graph given below and answer the following questions.

From 2011 to 2016, find the difference between the total number of people who preferred to play Basketball and Badminton (in millions) ?
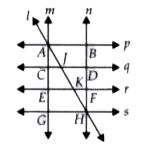
View SolutionWhich of the following set of points are collinear?

View SolutionThe simplification of
2.002+7.9+{2.8−6.3+(3.6−1.5)+15.6} gives
View SolutionDetermine the point of symmetry of a regular hexagon.
View SolutionDtermine the images of the following figure about the given line :
View SolutionMatch the following Column A to Column B

View SolutionMatch the following Column A to Column B

View SolutionMatch the following Column A to Column B

View SolutionFind the area of the figure given below.

View SolutionThe area of the shaded part in the figure given below is ______.

View SolutionThe inequation represented by the graph given below is :
View SolutionThe inequation that best describes the graph given below is _________
View SolutionThe inequation that best describes the following graph is _________
View Solution