Following is the pictrograph of different kinds of trees in a garden..
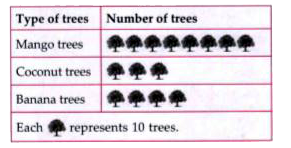
What is the difference between the number of mango trees and the number of banana trees?
40
30
80
60
The correct Answer is:A
Step by step video solution for Following is the pictrograph of different kinds of trees in a garden.. What is the difference between the number of mango trees and the number of banana trees? by Maths experts to help you in doubts & scoring excellent marks in Class 6 exams.
Updated on:21/07/2023Topper's Solved these Questions
- DATA HANDLING Book:MTG IIT JEE FOUNDATIONChapter:DATA HANDLING Exercise:Exercise (Multiple Choice Questions) Level -2
Explore 16 Videos
- DATA HANDLING Book:MTG IIT JEE FOUNDATIONChapter:DATA HANDLING Exercise:Exercise (Match the following)
Explore 2 Videos
- DATA HANDLING Book:MTG IIT JEE FOUNDATIONChapter:DATA HANDLING Exercise:NCERT Section (Exercise 9.4)
Explore 4 Videos
- BASIC GEOMETRICAL IDEASBook:MTG IIT JEE FOUNDATIONChapter:BASIC GEOMETRICAL IDEASExercise:OLYMPIAD/HOTS CORNER
Explore 10 Videos
- DECIMALSBook:MTG IIT JEE FOUNDATIONChapter:DECIMALSExercise:OLYMPIAD/HOTS CORNER
Explore 20 Videos
Similar Questions
The given pictograph shows the number of pizzas delivered by pizza hut during a week.
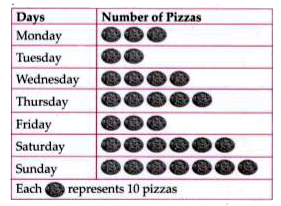
On which day, the number of pizzas delivered is minimum?
View SolutionMatch the following
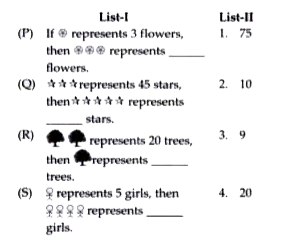
View SolutionA survey of 120 school students was done to find which activity they prefer to do in their free time.
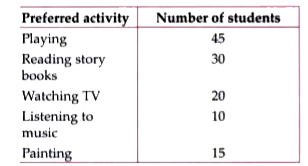
Draw a bar graph to illustrate the above data taking scale of 1 unit length = 5 students.
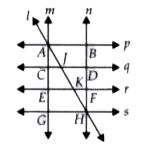
View SolutionWhich of the following set of points are collinear?
View SolutionThe simplification of
2.002+7.9+{2.8−6.3+(3.6−1.5)+15.6} gives
View SolutionHow many lines of symmetry does the above figure have ?
View SolutionWhich of the following are correct chain isomers of butane ? (i)
View SolutionDetermine the point of symmetry of a regular hexagon.
View SolutionDtermine the images of the following figure about the given line :
View SolutionMatch the following Column A to Column B

View SolutionMatch the following Column A to Column B

View SolutionMatch the following Column A to Column B

View SolutionThe inequation represented by the graph given below is :
View SolutionThe inequation that best describes the graph given below is _________
View SolutionThe inequation that best describes the following graph is _________
View SolutionWhich inequations represent the shaded region in the given figure
View Solution