The sales of a shopkeeper in the first week of january 2012, are given below :

Draw a graph representing the above data.
Step by step video solution for The sales of a shopkeeper in the first week of january 2012, are given below : Draw a graph representing the above data. by Maths experts to help you in doubts & scoring excellent marks in Class 8 exams.
Updated on:21/07/2023Topper's Solved these Questions
- INTRODUCTION TO GRAPHS Book:MTG IIT JEE FOUNDATIONChapter:INTRODUCTION TO GRAPHS Exercise:NCERT SECTIONS (15.1)
Explore 7 Videos
- INTRODUCTION TO GRAPHS Book:MTG IIT JEE FOUNDATIONChapter:INTRODUCTION TO GRAPHS Exercise:NCERT SECTIONS (15.2)
Explore 6 Videos
- INTRODUCTION TO GRAPHS Book:MTG IIT JEE FOUNDATIONChapter:INTRODUCTION TO GRAPHS Exercise:OLYMPIAD/HOTS CORNER
Explore 5 Videos
- FOOTSTEPS TOWARDS JEE MAINBook:MTG IIT JEE FOUNDATIONChapter:FOOTSTEPS TOWARDS JEE MAINExercise:Section B (Numerical Value Type Questions)
Explore 9 Videos
- LINEAR EQUATIONS IN ONE VARIABLEBook:MTG IIT JEE FOUNDATIONChapter:LINEAR EQUATIONS IN ONE VARIABLEExercise:Olympiad/HOTS Corner
Explore 15 Videos
Similar Questions
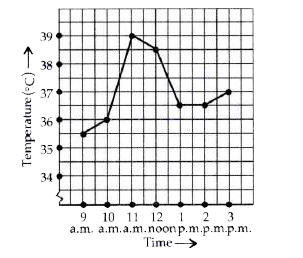
The following graph shows the temperature of a patient in a hospital , recorded every hour.

(a) What was the patient's temperature at 1 p.m. ?
(b) When was the patient's temperature 38.5∘C ?
(c ) The patient's temperature was the same two times during the period given. What were these two times?
(d) What was the temperature at 1.30 p.m.? How did you arrive at your answer?
(e) During which periods did the patient's temperature showed an upward trend?
View SolutionPlot the following points on a graph sheet. Verify if they lie on a line
A(4,0) , B(4,2) ,C(4,6) ,D(4,2.5)
View SolutionPlotting the following points, check which are not forming linear graph?
View SolutionFind x, if (511)−3×(511)5=(511)x
View SolutionFind the value of z.
z+6.1=0.5(z−0.4)0.35−0.6(z−2.71)0.42
View SolutionHow many lines of symmetry does the above figure have ?
View SolutionDetermine the point of symmetry of a regular hexagon.
View SolutionDtermine the images of the following figure about the given line :
View SolutionDraw the bisector of ∠AOB=58∘
ltimg src="https://d10lpgp6xz60nq.cloudfront.net/physics_images/PS_MATH_VII_C05_S01_009_Q01.png" width="80%"gt
View SolutionMatch the following Column A to Column B

View SolutionMatch the following Column A to Column B

View SolutionMatch the following Column A to Column B

View SolutionFind the area of figure given below.

View SolutionFind the perimeter of the figure given below.

View SolutionFind the area of the figure given below.

View SolutionThe area of the shaded part in the figure given below is ______.

View Solution