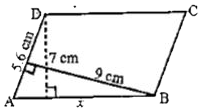
Find the value of x in the following parallelograms.
 Solution in Punjabi
Step by step video solution for Find the value of x in the following parallelograms. by Maths experts to help you in doubts & scoring excellent marks in Class 7 exams.
Updated on:21/07/2023Topper's Solved these Questions
- PERIMETER AND AREA Book:SWAN PUBLICATIONChapter:PERIMETER AND AREA Exercise:Exercise 11.2 (Multiple choice questions)
Explore 6 Videos
- PERIMETER AND AREA Book:SWAN PUBLICATIONChapter:PERIMETER AND AREA Exercise:Exercise 11.3
Explore 16 Videos
- PERIMETER AND AREA Book:SWAN PUBLICATIONChapter:PERIMETER AND AREA Exercise:Exercise 11.1 (Multiple Chocie questions)
Explore 6 Videos
- LINES AND ANGLES Book:SWAN PUBLICATIONChapter:LINES AND ANGLES Exercise:OTHER IMPORTANT QUESTIONS (III. State whether the following statements are True or False )
Explore 8 Videos
- PRACTICAL GEOMETRY Book:SWAN PUBLICATIONChapter:PRACTICAL GEOMETRY Exercise:OTHER IMPORTANT QUESTIONS
Explore 12 Videos
Similar Questions
Find the base of parallelogram whose are is 400 cm^2 and whose height is 8 cm.
View SolutionFind the circumference of circle whose
Radius (r ) = 3.5 cm
View SolutionWhat is the area of a rectangle of dimensions 12cm × 10 cm?
View SolutionSum of the measures of two complementary angles is 180∘
View SolutionFill in the blanks :
Through a poin not lying on the the given lines we can draw ……… parallel lines .
View SolutionWhich of the following are correct chain isomers of butane ? (i)
View SolutionDetermine the point of symmetry of a regular hexagon.
View SolutionDtermine the images of the following figure about the given line :
View SolutionMatch the following Column A to Column B

View SolutionMatch the following Column A to Column B

View SolutionMatch the following Column A to Column B

View SolutionFind the area of figure given below.

View SolutionFind the area of the figure given below.

View SolutionThe inequation represented by the graph given below is :
View SolutionThe inequation that best describes the graph given below is _________
View SolutionThe inequation that best describes the following graph is _________
View Solution