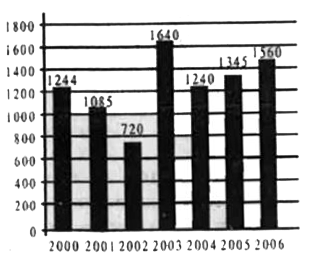
निम्न दंड आरेख वर्ष 2000 से 2006 तक आलू का उत्पादन ( क्विटंल में ) दर्शाता है।

इस अवधि के दौरान उत्पादन में अधिकतम हास की दर है :
(a) 24.4% (b) 28.22% (c) 33.64% (d) 35.32%
24.4%
28.22%
33.64%
35.32%
The correct Answer is:C
Step by step video solution for निम्न दंड आरेख वर्ष 2000 से 2006 तक आलू का उत्पादन ( क्विटंल में ) दर्शाता है। इस अवधि के दौरान उत्पादन में अधिकतम हास की दर है : (a) 24.4% (b) 28.22% (c) 33.64% (d) 35.32% by Maths experts to help you in doubts & scoring excellent marks in Class 14 exams.
Updated on:21/07/2023समान प्रश्न
The inequation that best describes the graph given below is _________
View SolutionThe inequation that best describes the following graph is _________
View SolutionWhich inequations represent the shaded region in the given figure
View SolutionThe bar chart shows the annual food grain production (in million tonnes) for years 2012-2017. For how many years is the production less than the average production during the given period? यह दंड आरेख वर्ष 2012-2017 की अवधि में वार्षिक खाद्यान्न उत्पादन (मिलियन टन में ) को दर्शाता है | कितने वर्ष उत्पादन इस अवधि के औसत उत्पादन से कम है ?
View SolutionThe bar graph given below shows the wheat production (in tonnes) of a large farm during the year 2011-2018. In how many years was wheat production higher than the average production of the period? नीचे दिए गए दंड आरेख में वर्ष 2011-2018 के दौरान किसी बड़े फार्म के गेहूं उत्पादन (टन में) को दर्शाया गया है | अवधि के औसत उत्पादन की तुलना में दिए गए कितने वर्षो में गेहूं उत्पादन अधिक था ?
View Solution'A' is the portion of adenophypophysis which secrets different hormones 'A' is____
View SolutionIdentify A,B,C and D,E
View SolutionConsider the following reactions.
View Solution
