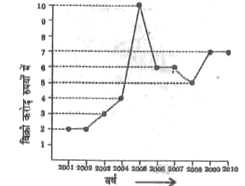
निम्नलिखित रेखा आरेख किसी कंपनी की वर्ष 2001-2010 के दौरान वार्षिक बिक्री के आंकड़ों को दर्शाता है। आरेख का अध्ययन करें और 5 से 9 तक प्रश्न के उत्तर दें।

वर्ष 2006 में बिक्री की तुलना में वर्ष 2008 में बिक्री में कितने प्रतिशत की कमी आई?
20
18
1623
1523
The correct Answer is:C
Step by step video solution for निम्नलिखित रेखा आरेख किसी कंपनी की वर्ष 2001-2010 के दौरान वार्षिक बिक्री के आंकड़ों को दर्शाता है। आरेख का अध्ययन करें और 5 से 9 तक प्रश्न के उत्तर दें। वर्ष 2006 में बिक्री की तुलना में वर्ष 2008 में बिक्री में कितने प्रतिशत की कमी आई? by Maths experts to help you in doubts & scoring excellent marks in Class 14 exams.
Updated on:21/07/2023समान प्रश्न
The following graph shows the sales of cars (in thousands) in four cities in 4 years. Study the graph and answer the questions.
निम्नलिखित आरेख 4 वर्षों में चार शहरों में कारों की बिक्री (हज़ार में) को दर्शाता है। इस आरेख का अध्ययन कीजिए तथा प्रश्नों के उत्तर दीजिए। Which city has the highest percentage of sales, and in which year?
किस शहर की बिक्री का प्रतिशत सबसे अधिक है तथा किस वर्ष में?
View SolutionThe following graph shows the sales of cars (in thousands) in four cities in 4 years. Study the graph and answer the questions.
निम्नलिखित आरेख 4 वर्षों में चार शहरों में कारों की बिक्री (हज़ार में) को दर्शाता है। इस आरेख का अध्ययन कीजिए तथा प्रश्नों के उत्तर दीजिए। In 2019, what is the average number of sales among all the four cities?
2019 में, सभी चार शहरों में औसत बिक्री कितनी रही है?
View SolutionIn the given bar graph, the Blue bar shows the income and the Red bar shows the expenditure of a company. Study the graph and answer the question that follows
दिए गए दंड आरेख में, नीला दंड एक कंपनी की आय दिखाता है और लाल दंड खर्च (लाख रुपये में) को दर्शाता है। आरेख का अध्ययन करें और उस प्रश्न का उत्तर दें जो नीचे पूछा गया है। The percentage decrease in the income of the company in 2002 as compared to that in 2001 is:
2001 की तुलना में 2002 में कंपनी की आय में कितने प्रतिशत में कमी आई है:
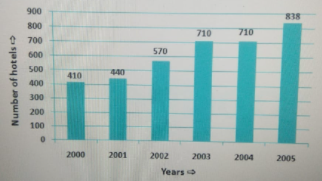
View SolutionStudy the chart and answer the questions:
In which of the given years is the percentage increase in the number of hotels in comparison to the previous year, is the maximum?
चार्ट का अध्ययन करें और प्रश्नों का उत्तर दें:पिछले वर्ष की तुलना में होटलों की संख्या में किस वर्ष में अधिकतम प्रतिशत वृद्धि हुई है?
View SolutionThe given Bar Graph presents Income and Expenditure (in crores of Rupees) of a company for five years, 2014 to 2018. In which year is the Expenditure more than 40% as compared to the Expenditure in the previous year? दिया गया दंड आरेख (बार ग्राफ) 5 वर्षो, 2014 से 2018 के दौरान किसी कंपनी की आय और व्यय (करोड़ रुपए में) को दर्शाता है| पिछले वर्ष के व्यय की तुलना में किस वर्ष में वह 40% अधिक है?
View SolutionThe given Bar Graph presents the Revenue of Expenditure (in crores of rupees) of a company during the five year period, 2014 - 2018. दिया गया दंड आरेख (Bar graph) 5 वर्ष की अवधि 2014-2018 के दौरान किसी कंपनी के राजस्व और व्यय (करोड़ रुपए में) को दर्शाता है| किस वर्ष में राजस्व में प्रति प्रतिशत वृद्धि इसके पिछले वर्ष की तुलना में 5% और 8% के बीच है? In which year the percentage increase in revenue as compared to that in its preceding year is between 5% and 8% ?
View SolutionThe given Bar Graph presents the number of students of two schools for six years. दिया गया दंड आरेख (बार ग्राफ) छह वर्षो के दौरान दो स्कूलों में विद्यार्थियों की संख्या को दर्शाता है| In which year, the percentage increase in students in school B is the highest in comparison to its previous year? किस वर्ष में, स्कूल B के विद्यार्थियों की संख्या में प्रतिशत वृद्धि इसके पिछले वर्ष की तुलना में सबसे अधिक है?
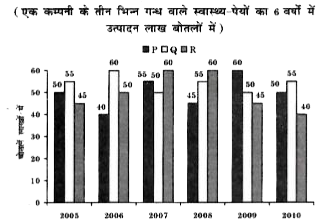
View SolutionWhat was the approximate decline in the prodcution of flavour R in 2010 as compared to the production of 2008 in percentage?
वर्ष 2008 की तुलना में वर्ष 2010 में गन्ध R के उत्पादन में कितने प्रतिशत की कमी आई थी?

View Solution