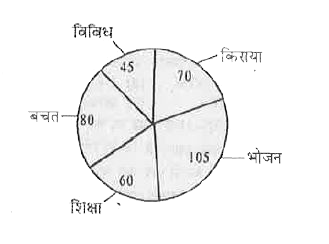
निम्न व्यय की संगत धनराशि डिग्री में कुछ व्यय=43200 रुपए

दिए गए पाई-चार्ट में किराया एवं शिक्षा को मिलाकर कुल व्यय भोजन एवं विविध मदों को मिलाकर कुल व्यय से कितना प्रतिशत कम है।?
26%
30%
20013%
403%
The correct Answer is:D
Step by step video & text solution for निम्न व्यय की संगत धनराशि डिग्री में कुछ व्यय=43200 रुपए दिए गए पाई-चार्ट में किराया एवं शिक्षा को मिलाकर कुल व्यय भोजन एवं विविध मदों को मिलाकर कुल व्यय से कितना प्रतिशत कम है।? by Maths experts to help you in doubts & scoring excellent marks in Class 14 exams.
Updated on:21/07/2023समान प्रश्न
The given Bar Graph presents Income and Expenditure (in crores of Rupees) of a company for the five years, 2014 to 2018. दिया गया दंड आरेख पांच वर्षों अर्थात 2014 से 2018 तक एक कंपनी के आय एवं व्यय ( करोड़ रुपये में ) को दर्शाता है | What is the ratio of total Expenditure to total Income of the company in 2014, 2016 and 2017? 2014, 2016 और 2017 में कंपनी के कुल व्यय और कुल आय में क्या अनुपात है ?
View SolutionThe given pie chart shows the expenditure given in millions on each game. दिया गया पाई चार्ट प्रत्येक खेल पर करोड़ो में दिए गए व्यय को दर्शाता है | In the given pie chart, what is the difference between expenditure on cricket and football ? दिए गए पाई चार्ट में , क्रिकेट और फुटबॉल पर किये गए व्यय के बीच क्या अंतर है ?
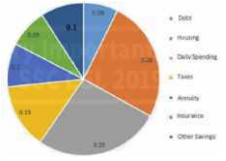
View SolutionThe Pie-chart given below shows the figures of various heads of expenditure incurred by Anurag in a year. In how many heads is his expenditure less than the expenditure he incurred on tax?
नीचे दिया गया वृत्त आरेख अनुराग द्वारा किसी वर्ष में किए गए व्यय के विभिन्न शीर्षों के आंकड़ों को दर्शाता है | उसके द्वारा टैक्स पर किए गए व्यय की तुलना में कितने शीर्षों में उसके व्यय कम हैं ?
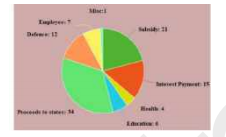
View SolutionThe following pie chart shows percentage expenditure of a country on different heads. The total expenditure in Rs. 1,680(in billion). Study the chart and answer the question.
निम्नलिखित पाई चार्ट अलग-अलग प्रमुखों पर किसी देश का प्रतिशत व्यय दर्शाता है। 1,680 (बिलियन में) कुल खर्च। चार्ट का अध्ययन करें और प्रश्न का उत्तर दें।
The expenditure on Education is what percentage less than the expenditure on defence ?
शिक्षा पर व्यय रक्षा पर व्यय से कितना प्रतिशत कम है |
View SolutionThe given Bar Graph presents Income and Expenditure (in crores of Rupees) of a company for five years, 2014 to 2018. The total Income of the company in 2015, 2017 and 2018 is approximately what percent less than the total Expenditure in the five years? दिया गया दंड आरेख (बार ग्राफ) 5 वर्षो, 2014 से 2018 के दौरान किसी कंपनी की आय और व्यय (करोड़ रुपए में) को दर्शाता है 2015, 201 और 2018 में कंपनी की कुल आय, 5 वर्षो में कुल व्यय से लगभग कितने प्रतिशत कम है?
View SolutionThe given Bar Graph presents Income and Expenditure (in crores of Rupees) of a company for five years, 2014 to 2018. What is the ratio of total Expenditure to total Income of the company in 2014,2016 and 2017? दिया गया दंड आरेख (बार ग्राफ) 5 वर्षों, 2014 से 2018 के दौरान किसी कंपनी की आय और व्यय (करोड़ रुपए में) को दर्शाता है| 2014, 2016 और 2017 में कंपनी के कुल व्यय और कुल आय का अनुपात क्या है?
View SolutionStudy the following graph which shows income and expenditure of a company over the years and answer the questions. In how many years was the expenditure of the company more than the average expenditure of the given years? निम्नलिखित चार्ट का अध्ययन कीजिए जिसमें कंपनी की कुछ वर्षों की आय एवं उसके व्यय को दर्शाया गया है और प्रश्नों के उत्तर दीजिए : कितने वर्षों में कंपनी का व्यय दिए गए वर्षों के औसत व्यय से अधिक था?
View SolutionStudy the following graph which shows income and expenditure of a company over the years and answer the questions. Ratio of total income to total expenditure of the company over the years is. निम्नलिखित चार्ट का अध्ययन कीजिए जिसमें कंपनी की कुछ वर्षों की आय एवं उसके व्यय को दर्शाया गया है और प्रश्नों के उत्तर दीजिए : दिए गए वर्षों में कंपनी की कुल आय और कुल व्यय का अनुपात क्या रहा?
View Solution