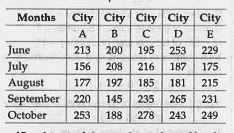
The table below depicts the Number of books Sold by 5 cities during 5 months. Study the following table and answer the questions.

What is the average number of books sold by city C in July, September and October together?
243
242
234
224
Step by step video solution for The table below depicts the Number of books Sold by 5 cities during 5 months. Study the following table and answer the questions. What is the average number of books sold by city C in July, September and October together? by Maths experts to help you in doubts & scoring excellent marks in Class 14 exams.
Updated on:21/07/2023Similar Questions
Find the area of the figure given below.

View SolutionThe area of the shaded part in the figure given below is ______.

View SolutionThe inequation represented by the graph given below is :
View SolutionThe inequation that best describes the graph given below is _________
View SolutionThe inequation that best describes the following graph is _________
View Solution'A' is the portion of adenophypophysis which secrets different hormones 'A' is____
View SolutionIdentify A,B,C and D,E
View SolutionConsider the following reactions.
View Solution
