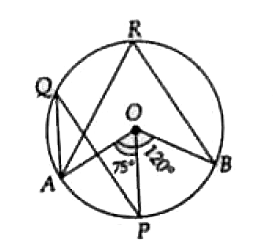
In the figure given below, if ∠AOP=75∘and∠AOB=120∘, then what is ∠AQP?

45∘
37.5∘
30∘
22.5∘
The correct Answer is:B
Step by step video & text solution for In the figure given below, if angle AOP = 75^(@) and angle AOB = 120^(@), then what is angle AQP? by Maths experts to help you in doubts & scoring excellent marks in Class 14 exams.
Updated on:21/07/2023Topper's Solved these Questions
- CIRCLE AND ITS TANGENT LINESBOOK - LUCENT PUBLICATIONCHAPTER - CIRCLE AND ITS TANGENT LINESEXERCISE - EXERCISE 8B
27 Videos
- CIRCLE AND ITS TANGENT LINESBOOK - LUCENT PUBLICATIONCHAPTER - CIRCLE AND ITS TANGENT LINESEXERCISE - EXERCISE 8B
27 Videos
- CENTRE OF TRIANGLEBOOK - LUCENT PUBLICATIONCHAPTER - CENTRE OF TRIANGLEEXERCISE - EXERCISE-6B
8 Videos
- CONGRUENCE AND SIMILAR TRIANGLES BOOK - LUCENT PUBLICATIONCHAPTER - CONGRUENCE AND SIMILAR TRIANGLES EXERCISE - EXERCISE-5B
8 Videos
Similar Questions
Two tangents are drawn from a point P on the circle at point A and B. O is the centre of the circle. If ∠AOP=60∘ then find ∠APB.
View SolutionTwo tangents are drawn from a point P on the circle at point A and B. O is the centre of the circle. If ∠AOP=60∘ then find ∠APB.
View SolutionIn ΔABC, AD is median and AD = 1/2 BC. If ∠BAD=30∘ then find ∠ACB.
View Solution2 sides of triangle are of 4 cm and 10 cm. If 3rd side is length of 'a' cm then which is correct value for a.
View SolutionDetermine the point of symmetry of a regular hexagon.
View SolutionDtermine the images of the following figure about the given line :
View SolutionIn the given figure, AB is a diameter, O is the center of the circle and ∠OCB=50∘ then find ∠DBC.
View SolutionMatch the following Column A to Column B

View SolutionMatch the following Column A to Column B

View SolutionMatch the following Column A to Column B

View SolutionFind the area of figure given below.

View SolutionFind the perimeter of the figure given below.

View SolutionFind the area of the figure given below.

View SolutionThe area of the shaded part in the figure given below is ______.

View SolutionThe inequation represented by the graph given below is :
View SolutionThe inequation that best describes the graph given below is _________
View Solution
