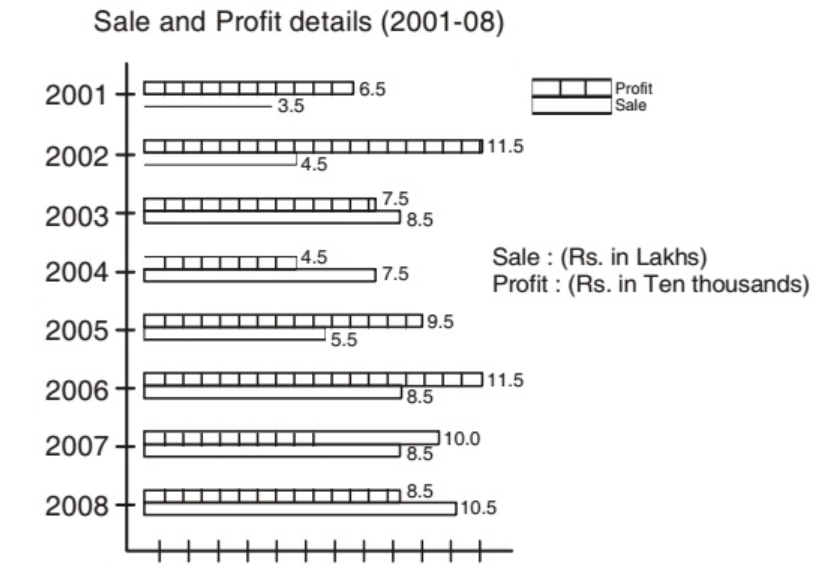
The bar graph as shown below gives information about the sale and profit details of a departmental. store during the years from 2001-08. Study the graph carefully and answer the questions asked here under.

During which of the following years percentage of profit earned by the store on the total sale was at the highest level ?
2001
2002
2003
2005
The correct Answer is:B
Step by step video solution for The bar graph as shown below gives information about the sale and profit details of a departmental. store during the years from 2001-08. Study the graph carefully and answer the questions asked here under. During which of the following years percentage of profit earned by the store on the total sale was at the highest level ? by Maths experts to help you in doubts & scoring excellent marks in Class 14 exams.
Updated on:21/07/2023Topper's Solved these Questions
Similar Questions
The simplified value of √1.21×0.91.1×0.11is -
View SolutionIf a, b. c, d, e are five consecutive odd numbers, their average is:
View SolutionFollowing information is available for the year 2016-17, calculate gross profit ratio:
View Solution
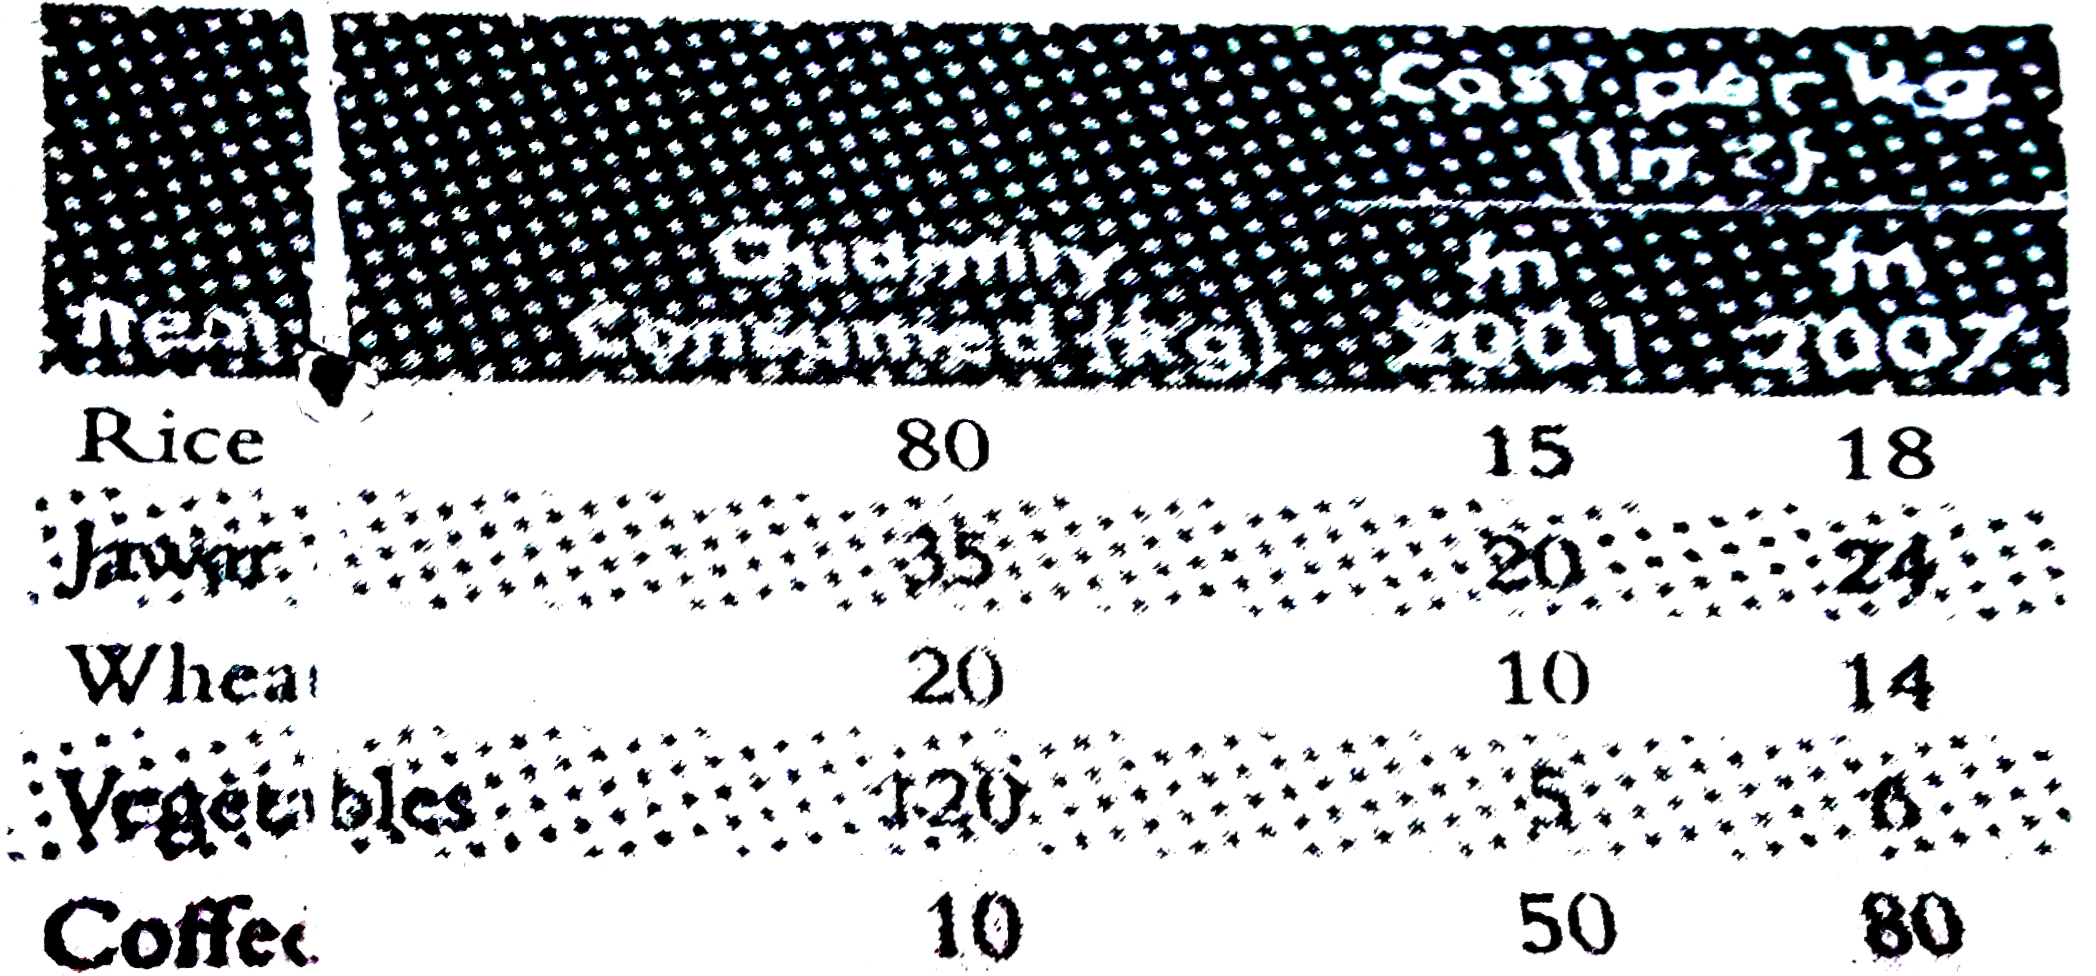
Find the cost of living index in the year 2007, taking 2001 as the base year, based on the information given above.
View SolutionWhich of the following are correct chain isomers of butane ? (i)
View SolutionDetermine the point of symmetry of a regular hexagon.
View SolutionDtermine the images of the following figure about the given line :
View SolutionMatch the following Column A to Column B

View SolutionMatch the following Column A to Column B

View SolutionMatch the following Column A to Column B

View SolutionThe inequation represented by the graph given below is :
View SolutionThe inequation that best describes the graph given below is _________
View SolutionThe inequation that best describes the following graph is _________
View SolutionWhich of the following statement is not correc for following straight line graph :-
ltimg src="https://d10lpgp6xz60nq.cloudfront.net/physics_images/ALN_PHY_R04_E01_015_Q01.png" width="80%"gt
View SolutionMagnitude of slope i.e. steepness of graph shown in figure ltimg src="https://d10lpgp6xz60nq.cloudfront.net/physics_images/ALN_PHY_R04_E01_026_Q01.png" width="80%"gt
View SolutionWhich of the following statement is not correct for following straight line graph :-
ltimg src="https://d10lpgp6xz60nq.cloudfront.net/physics_images/ALN_PHY_R04_E01_015_Q01.png" width="80%"gt
View Solution
