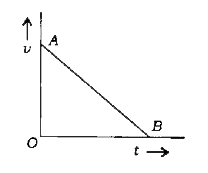
The velocity- time (v−t) graph shown above illustrates
uniform acceleraion of an object
Uniform retardation of an object
( non - uniform acceleration of an object
non - uniform retardation of an abject
Step by step video solution for The velocity- time (v-t) graph shown above illustrates by General Knowledge experts to help you in doubts & scoring excellent marks in Class 14 exams.
Updated on:21/07/2023Similar Questions
रैखिक समीकरण युग्म को प्रतिस्थापन विधि से हल कीजिए : s−t=3 s3+t2=6
View Solutionयदि रेखिक समीकरणों का कोई युग्म सगत है ,तो इसके आलेख की रेखाए होगी :
View Solutionनिम्नलिखित अभिक्रिया का समय स्थिरांक ज्ञात करो -
Fe+CuSO4⇔FeSO4+Cu (T=25∘C)
दिया है -
EO.P.(Fe/Fe2+)=+0.44 वोल्ट ,
ER.P.(Cu/Cu2+)=−0.337 वोल्ट
View Solutionयदि x=a(cost+logtant2),y=asint,d2ydt2 और d2ydx2 ज्ञात कीजिए |
View Solution−π और π के बीच sin x का लेखाचित्र खींचे
View Solutionलेखाचित्र से हल करे
xtanx:x=0 तथा x=π2 के बीच
View Solutionपहले बहुपद से दूसरे बहुपद को भाग करके, जॉंच कीजिए कि क्या प्रथम बहुपद द्वितीय बहुपद का एक गुणनखण्ड है :
g(t)=t2−3,f(t)=2t4+3t3−2t2−9t−12
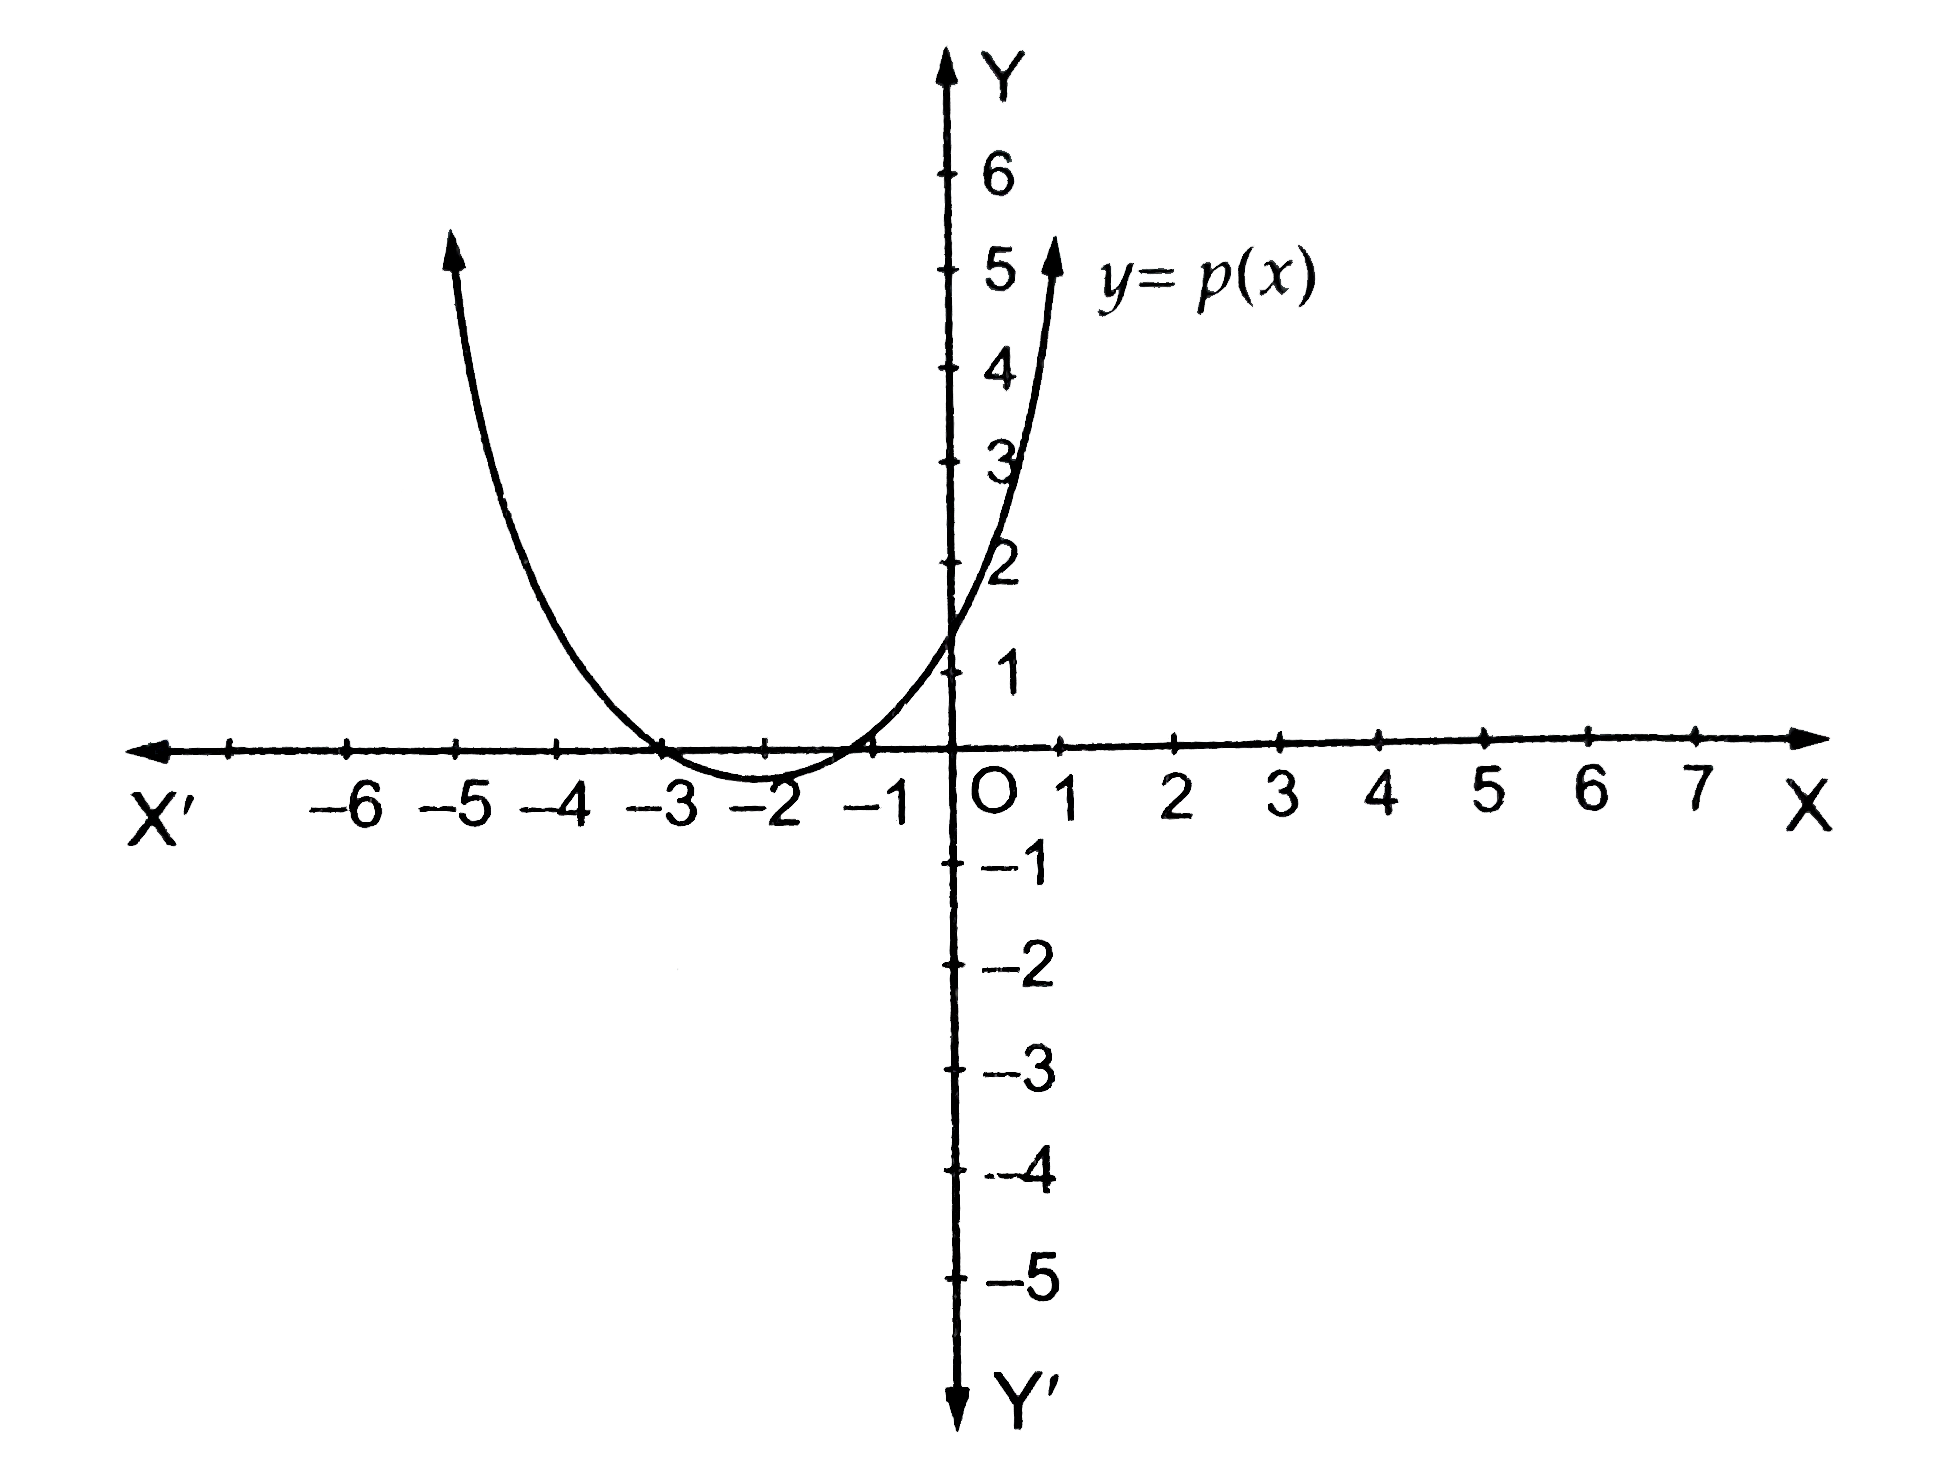
View Solutionयदि चित्र बहुपद p(x) का आलेख दर्शाता हो, तो बहुपद के शून्यक ज्ञात करे |

View Solution