The give graph represents the percentage distibution of the total expenditure of a company. Study the graph and answer the question that follows .
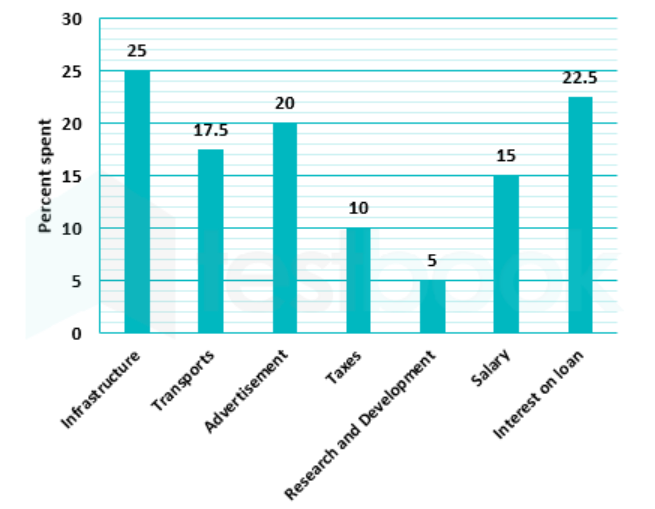
The total expenditure of the company is how many times the total expenditure on 'Research and Development' and 'Salary'?
5.75
7.75
6.75
8.75
The correct Answer is:A
Step by step video solution for The give graph represents the percentage distibution of the total expenditure of a company. Study the graph and answer the question that follows . The total expenditure of the company is how many times the total expenditure on 'Research and Development' and 'Salary'? by Maths experts to help you in doubts & scoring excellent marks in Class 14 exams.
Updated on:21/07/2023Similar Questions
The given graph represents the percentage distribution of the total expenditure of a company. Study the graph and answer the question that follows,
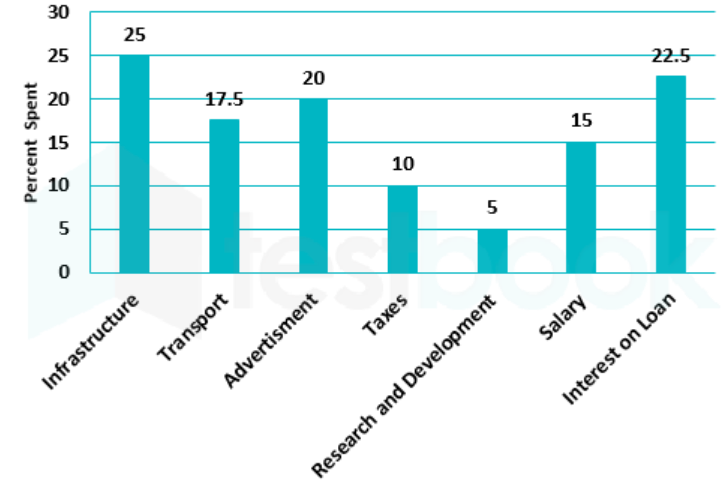
The expenditure on 'Interest on loans' is what percentage more than the expenditure on 'Transpott' ?
View SolutionThe given graph represents the percentage distribution of the total expenditure of a company. Study the graph and answer the question that follows .
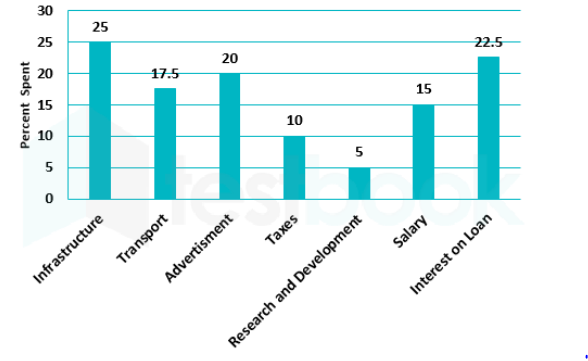
What is the ratio of the total expenditure on 'Infrastructure' and 'Transport' to the total expenditure on 'Taxes' and 'Interset on Loans' ?
View Solution
Knowledge Check
The bar diagram shows the monthly expenditure of a company. Study the graph and answer the questions.
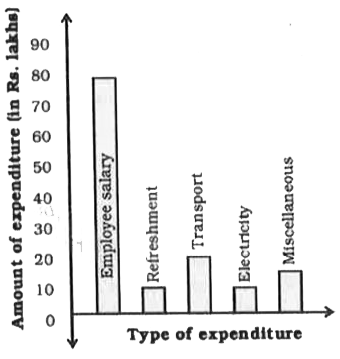
The total monthly expenditure of the company is :ARs. 153 lakhsBRs. 315 lakhsCRs. 135 lakhsDRs. 531 lakhsThe bar diagram shows the monthly expenditure of a company. Study the graph and answer the questions.
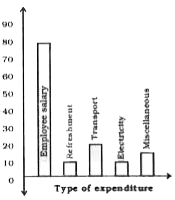
The total monthly expenditure of the company is :ARs. 153 lakhsBRs. 315 lakhsCRs. 135 lakhsDRs. 531 lakhsThe bar diagram shows the monthly expenditure of a company. Study the graph and answer the questions.
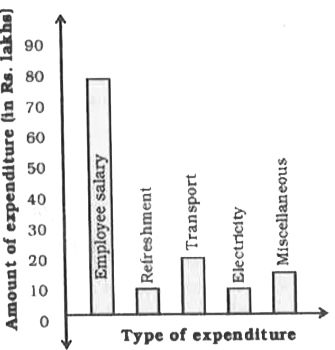
The percentage of money spent on miscellaneous isA7217B1727C1119D9111
The bar-graph given below shows the percentage distribution of total expenditures of a company under various expense heads during 2013. Study the graph and answer the given questions.
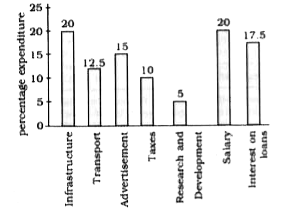
If the total ammount of expenditure of the company in N times the expenditure on reach and development, then the value of N is
View SolutionThe graph shows Income and Expenditure of a company. Study the graph and answer the questions.
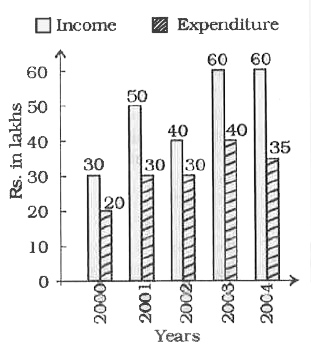
The expenditure from 2002 to 2003 increased by
View SolutionThe graph shows Income and Expenditure of a company. Study the graph and answer the questions.
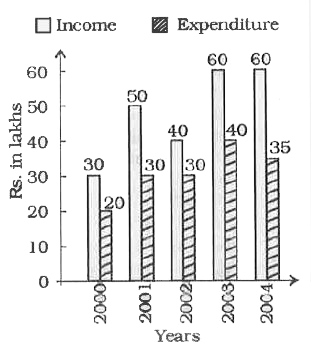
The income in 2002 was equal to the expenditure in the year
View SolutionThe graph shows Income and Expenditure of a company. Study the graph and answer the questions.
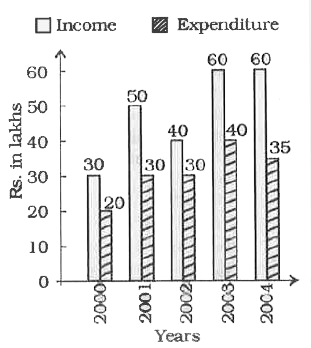
The profit was maximum in the year
View SolutionThe bar diagram shows the monthly expenditure of a company. Study the graph and answer the questions.
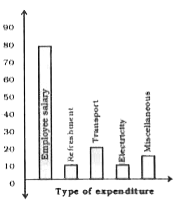
The percentage of money spent on miscellaneous is
View Solution
