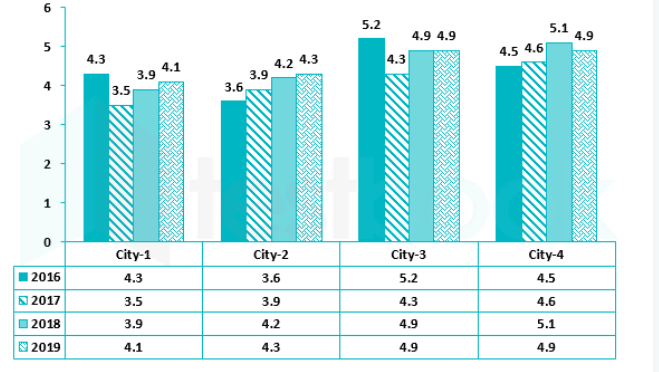
The following graph shows the sales of cars (in thousands) in four cities in 4 years. Study the graph and answer the question

In which year. the sales are highest?
2018
2017
2016
2019
The correct Answer is:D
Step by step video solution for The following graph shows the sales of cars (in thousands) in four cities in 4 years. Study the graph and answer the question In which year. the sales are highest? by Maths experts to help you in doubts & scoring excellent marks in Class 14 exams.
Updated on:21/07/2023Similar Questions
The inequation that best describes the graph given below is _________
View SolutionThe inequation that best describes the following graph is _________
View SolutionWhich inequations represent the shaded region in the given figure
View SolutionWhich of the following statement is not correc for following straight line graph :-
ltimg src="https://d10lpgp6xz60nq.cloudfront.net/physics_images/ALN_PHY_R04_E01_015_Q01.png" width="80%"gt
View SolutionWhich of the following statement is not correct for following straight line graph :-
ltimg src="https://d10lpgp6xz60nq.cloudfront.net/physics_images/ALN_PHY_R04_E01_015_Q01.png" width="80%"gt
View Solution'A' is the portion of adenophypophysis which secrets different hormones 'A' is____
View SolutionIdentify A,B,C and D,E
View SolutionConsider the following reactions.
View Solution