The following pie-chart shows the percentage-wise distribution of the number of students in five different schools P, Q, R, S and T. The total number of students in all five schools together is 8400.

Find the average number of students in schools R and S together.
1510
1612
1512
1620
The correct Answer is:C
Step by step video solution for The following pie-chart shows the percentage-wise distribution of the number of students in five different schools P, Q, R, S and T. The total number of students in all five schools together is 8400. Find the average number of students in schools R and S together. by Maths experts to help you in doubts & scoring excellent marks in Class 14 exams.
Updated on:21/07/2023সম্পর্কিত প্রশ্ন
The following pie chart shows the percentage-wise distribution of the number of students in five different schools P, Q, R, S and T. The total number of students in all five schools together is 8400.
निम्नलिखित पाई चार्ट पांच अलग-अलग स्कूलों P, Q, R, S और T में छात्रों की संख्या के प्रतिशत को दर्शाता है। सभी पाँच स्कूलों में कुल छात्रों की संख्या 8400 है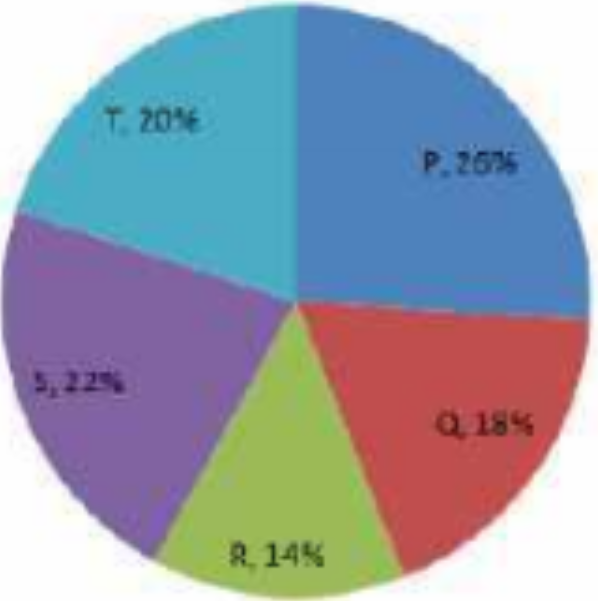 Find the average number of students in schools R and S together.
स्कूलों R और S में एक साथ छात्रों की औसत संख्या ज्ञात कीजिए।
View SolutionThe following pie chart shows the percentage wise distribution of the number of students in five different schools, P, Q, R, S and T. Total number of students in all five schools together is 8400.
निम्नलेखित पाई चार्ट पाँच अलग-अलग स्कूलों, P, Q, R, Sऔर T में छात्रों की संख्या का प्रतिशत वार वितरण दर्शाता है। सभी पाँच स्कूलों में कुल छात्रों की संख्या 8400 है। The number of students in school T is what percentage of the total number of students in school Q and S together.
स्कूल T में छात्रों की संख्या, स्कूल Q और S में कुल छात्रों की संख्या का कितना प्रतिशत है?
View Solution
জ্ঞান পরীক্ষা করুন
The pie-chart shows the percentage-wise distribution of the number of students in five different schools P,Q,R,S and T .
The total number of students in all five schools together is 10,500 .
Study the pie -chart and answer the question .
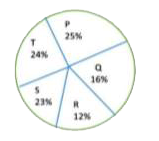
The number of students in school R is what per cent of the total number of students in schools Q and T together ?A40%B35%C25%D30%The pie-chart shows the percentage-wise distribution of the number of students in five different schools P,Q,R,S and T .
The total number of students in all five schools together is 10,500 .
Study the pie -chart and answer the question .
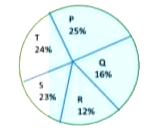
The difference between the central angles corresponding to schools T and R is :A42.8∘B44∘C43.2∘D34.5∘
The average number of student in both School P and Q.A1425B1575C1450D2750
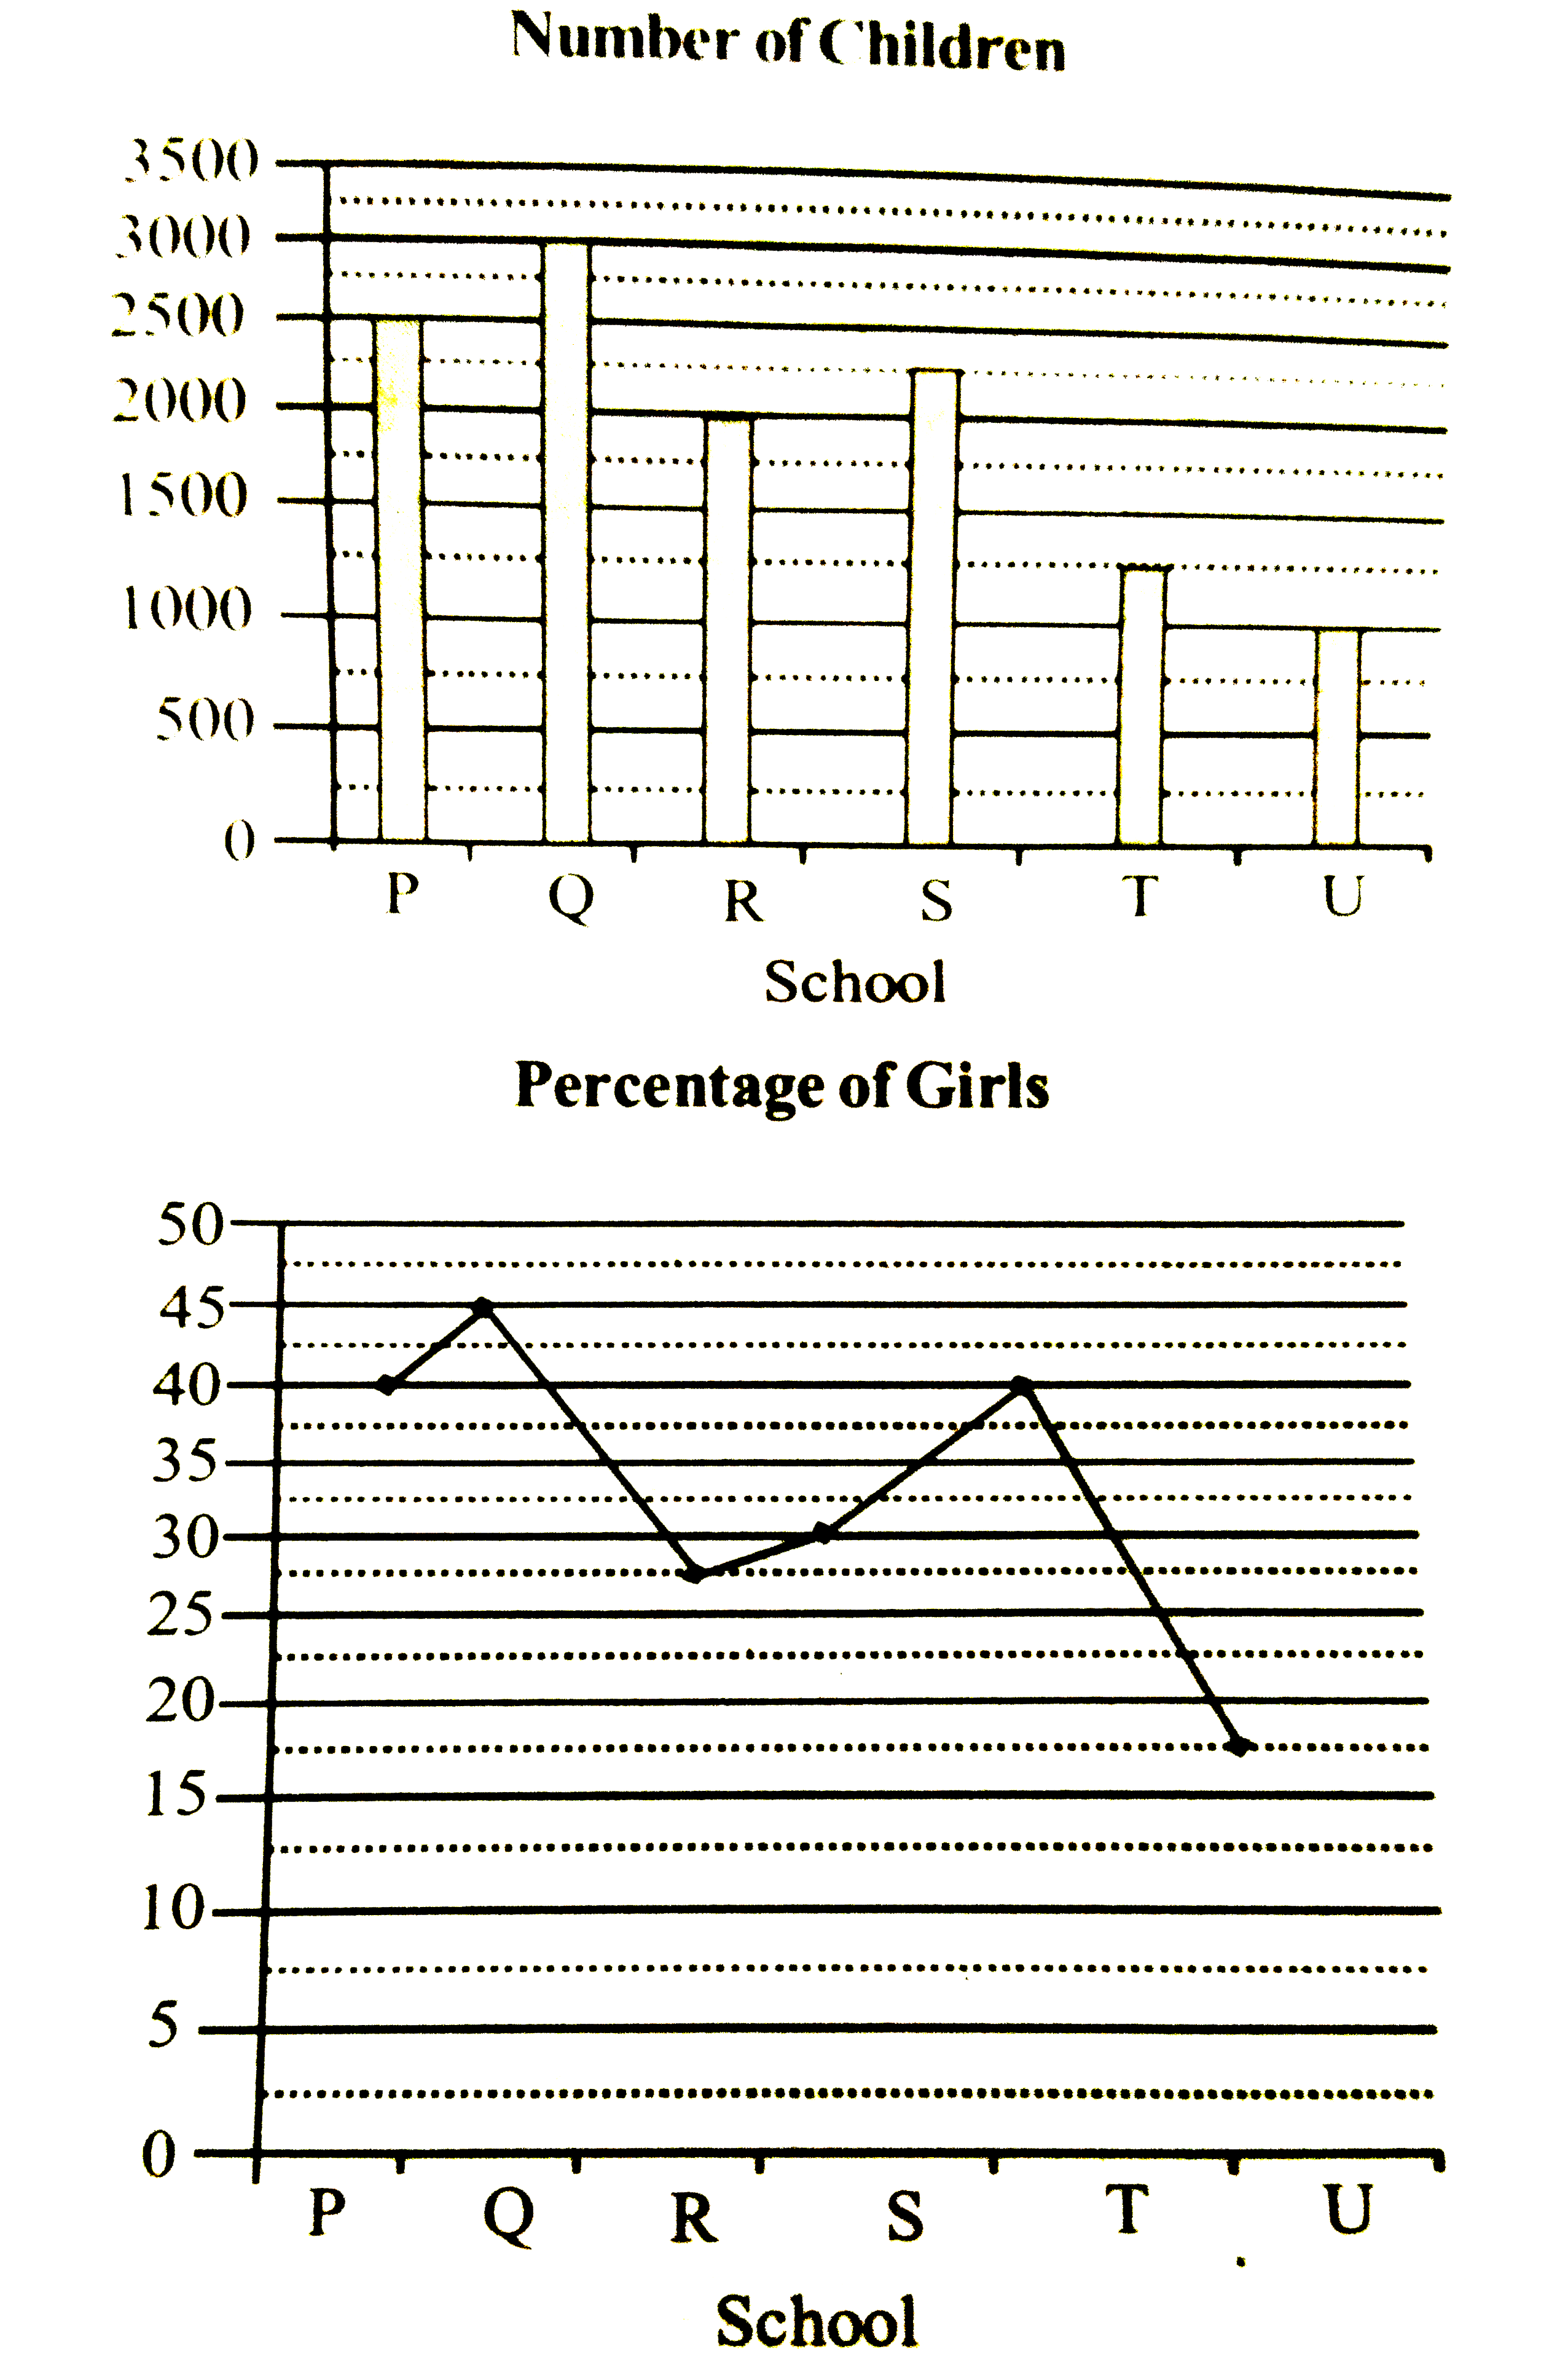
The total number of student in school R, is approximately what percent of the total number of student in school S?
View Solution60% students in a school are boys.Find the total number of students in the school if 120 are girls
View SolutionThe given pie-chart represtns the percentage of students enrolled in five different sports. The total number of students is 2800.

What is the average number of students enrolled in Hockey and Tennis together?
View SolutionStudy the given pie chart and answer the question that follows.
Break-up (degree-wise) of the number of students in five schools (A, B, C, D and E) in a city.
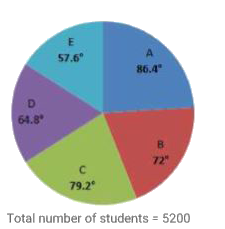
If the total number of students in schools D and E exceeds the number of students in school A by x, then x lies between:
View SolutionThe given pie-chart represents the percentage of students enrolled in five different sports. The total number of students is 2800.

What is the average number of student enrolled in Hockey and Tennis together ?
View Solution