Study the chart carefully and answer the questions.
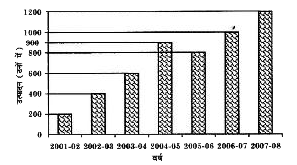
The chart shows production of an item (in tones) during certain years.
The production in 2006-07 in comparison to the production in 2002-03 increased by.
निम्न आरेख का ध्यानपूर्वक अध्ययन कर दिए गए प्रश्नों के उत्तर दें:
आरेख किसी वर्ष के दौरान एक मद का उत्पादन (टनों में) दर्शाता है।
वर्ष 2002-03 की तुलना में 2006-07 में उत्पादन में वृद्धि हुई -

125%
150%
110%
120%
The correct Answer is:B
% वृद्धि = 1000−400400×100=150%
Similar Questions
Study the graph and answer the questions based on the graph:
आरेख का अध्ययन करें और आरेख के आधार पर प्रश्नों के उत्तर दें: What was the percentage decline in the production from Friday to Saturday?
शुक्रवार से शनिवार तक उत्पादन में कितने प्रतिशत की गिरावट रही?
View SolutionStudy the given chart carefully and answer the question accordingly:
दिए गए चार्ट का ध्यानपूर्वक अध्ययन करें और उसके अनुसार प्रश्न का उत्तर दें: In which of the following years was the percentage increase in production from the previous year, the maximum among the given years?
पिछले वर्ष की तुलना में निम्नलिखित वर्षों में से किस वर्ष में उत्पादन में अधिकतम प्रतिशत वृद्धि हुई?
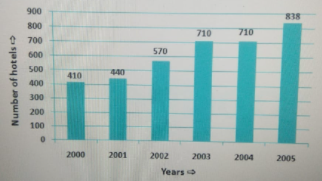
View SolutionStudy the chart and answer the questions:
In which of the given years is the percentage increase in the number of hotels in comparison to the previous year, is the maximum?
चार्ट का अध्ययन करें और प्रश्नों का उत्तर दें:पिछले वर्ष की तुलना में होटलों की संख्या में किस वर्ष में अधिकतम प्रतिशत वृद्धि हुई है?
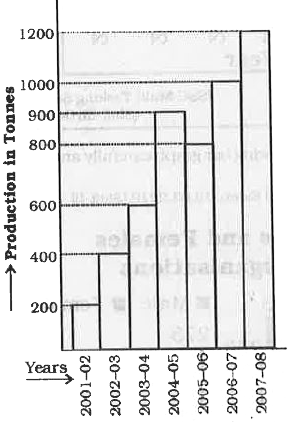
View SolutionStudy the graph carefully and answer the questions.

The graph shows production of an item (in tonnes) during certain years
The production in 2006-07 in comparison to the production in 2002-03 increased by
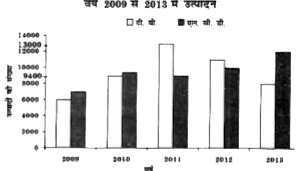
View SolutionStudy the following bar diagram carefully and answer the following questions :
निम्नलिखित आरेख का ध्यानपूर्वक अध्ययन करें और दिए गए प्रश्नों का उत्तर दें:

The ratio of production of LCDs in the year 2011 and 2013 is.
वर्ष 2011 और 2013 में एल. सी. डी. के उत्पादन का अनुपात है
View SolutionStudy the following bar diagram carefully and answer the following questions : निम्नलिखित आरेख का ध्यानपूर्वक अध्ययन करें और दिए गए प्रश्नों का उत्तर दें: The total number of a products of electronic items is maximum in the year. इलेक्ट्रॉनिक मदों के उत्पादन की कुल संख्या किस वर्ष में सबसे अधिक है?
View SolutionStudy the following bar diagram carefully and answer the following questions : निम्नलिखित आरेख का ध्यानपूर्वक अध्ययन करें और दिए गए प्रश्नों का उत्तर दें: The ratio of production of TVs in the years 2009 and 2010 is. वर्ष 2009 और 2010 में टी. वी. के उत्पादन का अनुपात -
View SolutionStudy the following bar diagram carefully and answer the following questions : निम्नलिखित आरेख का ध्यानपूर्वक अध्ययन करें और दिए गए प्रश्नों का उत्तर दें: The difference between averages of production of TVs and LCDs from 2009 to 2012 is. वर्ष 2009 से 2012 तक टी. वी. और एल. सी. डी. के उत्पादन के औसत में अंतर है
View Solution