Study the chart and answer the question based, on the pie chart.
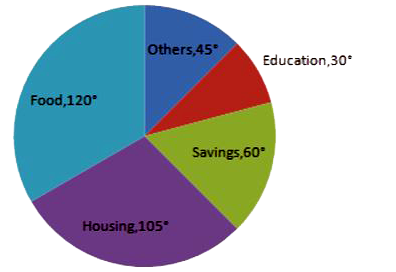
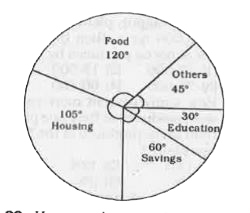
The pie chart given below shows expenditures incurred by a family on various items and savings in a month. Savings of the family is month. Savings of the family is ₹ 8,000 in a month.

How much more amount is spent on food than on housing ?
₹2,000
₹3,000
₹1,000
₹2,500
The correct Answer is:A
Step by step video & text solution for Study the chart and answer the question based, on the pie chart. The pie chart given below shows expenditures incurred by a family on various items and savings in a month. Savings of the family is month. Savings of the family is ₹ 8,000 in a month. How much more amount is spent on food than on housing ? by Maths experts to help you in doubts & scoring excellent marks in Class 14 exams.
Updated on:21/07/2023Similar Questions
The pie-chart given here shows expenditures incurred by a family on various items and their savings, which amounts to Rs 8,000 in a month.
Study the chart and answer the questions based on the pie-chart

How much more amount is spent on food than on housing ?
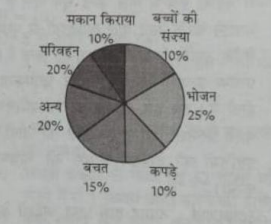
View Solutionसंलग्न पाई चार्ट एक महीने में एक परिवार के विभिन्न मर्दों में से व्यय और उसकी बचत ( प्रतिशतों में) दर्शाता है।

किसी मद a में व्यय सबसे अधिक था ?
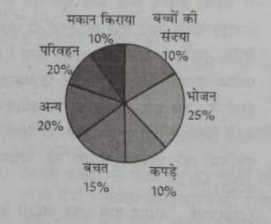
View Solutionसंलग्न पाई चार्ट एक महीने में एक परिवार के विभिन्न मर्दों में से व्यय और उसकी बचत ( प्रतिशतों में) दर्शाता है।

किसी मद पर हुआ व्यय परिवार की कुल बचत के बराबर है ?
View SolutionThe following pie-chart shows the monthly expenditure incurred by a family on various items , and their , and their savings . Study the chart and answer the question that follows. If the expenditure on education is ₹ 2,700 more than on housing , then the total expenditure on food and clothing is :
View SolutionStudy the chart and answer the question based, on the pie chart. The pie chart given below shows expenditures incurred by a family on various items and savings in a month. Savings of the family is ₹ 8,000 in a month. What is the total expenditure of the family for the month ?
View SolutionStudy the chart and answer the question based, on the pie chart. The pie chart given below shows expenditures incurred by a family on various items and savings in a month. Savings of the family is ₹ 8,000 in a month. The ratio of the expenditure on food to the saving is :
View SolutionStudy the given pie chart carefully and answer the question based on it. Below pie chart given the expenditure (in percentage) on various items and savings of a family during a month. Expenditure on which item is equal to the total savings of the family?
View Solution