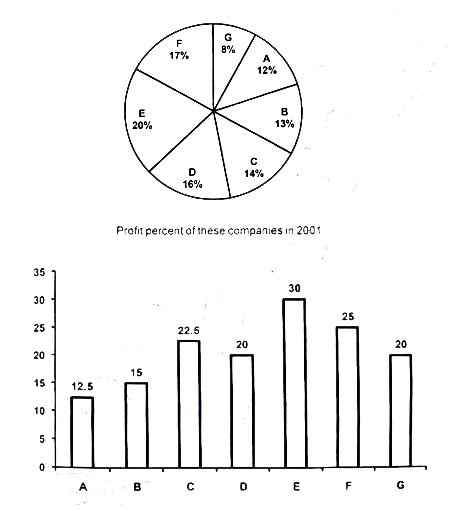
Read the following pie and bargraph carefully and answer the questions given below.
Income of seven companies in a state in the year 2001
Total income of all companies = ₹ 3500 cr.
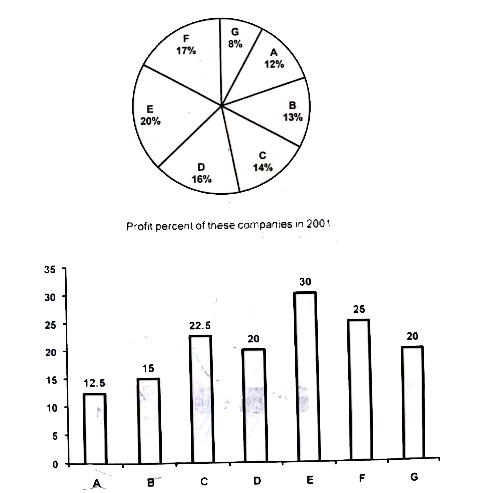
Half of the combined income of all the seven companies consists of total incomes of which combination of companies ?
C, D, E and G
A, B, C and D
E, F and G
A, B, F and G
The correct Answer is:D
Step by step video & text solution for Read the following pie and bargraph carefully and answer the questions given below. Income of seven companies in a state in the year 2001 Total income of all companies = ₹ 3500 cr. Half of the combined income of all the seven companies consists of total incomes of which combination of companies ? by Maths experts to help you in doubts & scoring excellent marks in Class 14 exams.
Updated on:21/07/2023Topper's Solved these Questions
Similar Questions
Study the following graph carefully and answer the question given below-
Amount of Rice, Wheat and Sugar Consumed by various restaurants over a years.
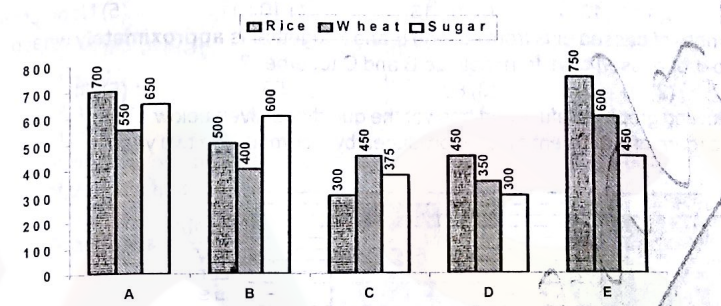
What is the respective ratio of the amount of Rice, Wheat and Sugar consumed by restaurant D to the same consumed by restaurant B ?
View SolutionIn one hour,a boat goes 11 km along the stream and 5 km against the stream. Then speed of the boat in still water (in km/hr) is :
View SolutionThe total of the present ages of A,B,C and D is 96 years. What is B's present age ?
(i) The average age of A, B and D is 20 years.
(ii) The average age of C and D is 25 years.
View SolutionThe inequation represented by the graph given below is :
View SolutionThe inequation that best describes the graph given below is _________
View Solution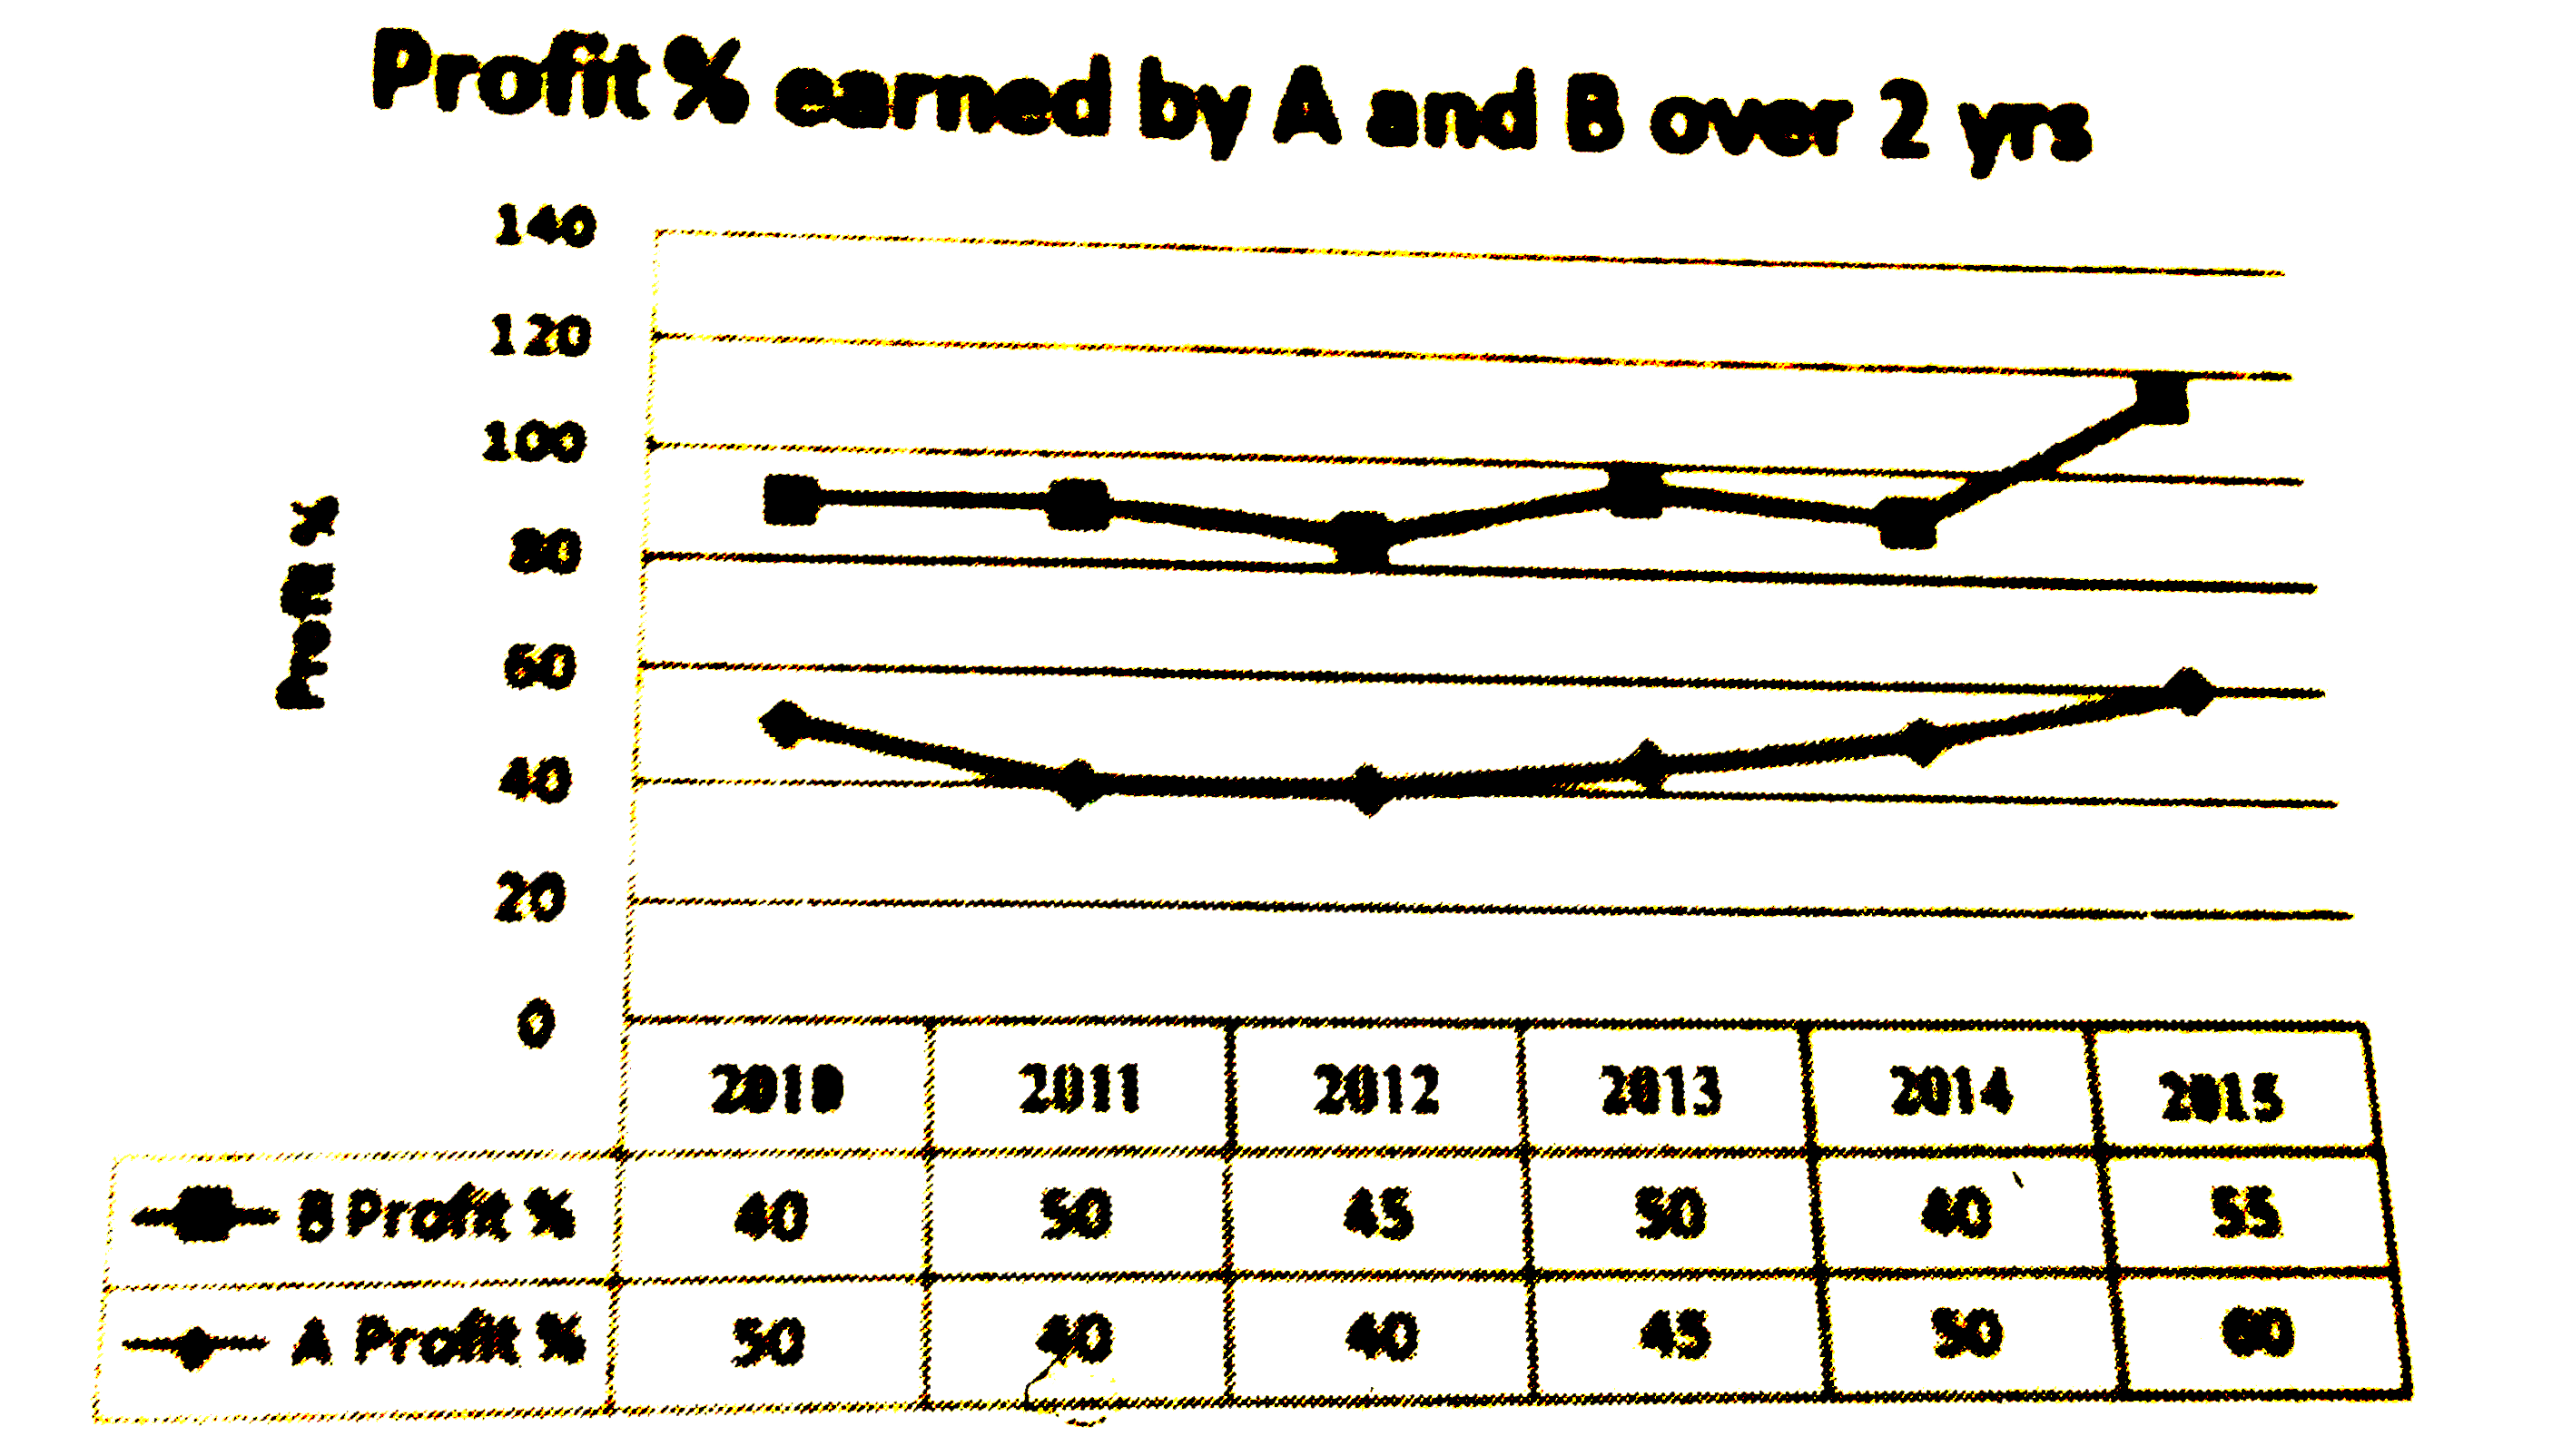
Total Expenditure of company B in all the years together was Rs. 125 L . What was the total income of the company in all the year together ?
View SolutionThe graph shows Income and Expenditure of a company. Study the graph and answer the questions. The number of years in which the income exceeds the average income is
View SolutionIncome and expenses of a company ( xx 100 in crores) What was the average income (in Rs. crore) of the company over all the years?
View SolutionIncome and expenses of a company ( xx 100 in crores) The total expenditure of the years 1995 and 1996 was equal to the income of which year?
View SolutionIncome and Expenditure of a Tire Company (Rs. in Crores) What is the total loss or profit of the company for all the years together?
View SolutionStudy the following graph which shows income and expenditure of a company over the years 2005 - 2009 and answer the questions.
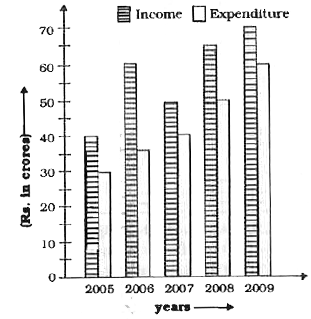
In how many years was the income of the company less than the average income of the given years ?
View SolutionFollowing graph shows the income of a company in six different years. Study the graph , carefully and the questions that follow. Find the percentage decrease in income from 2001 to 2002.
View SolutionFollowing graph shows the income of a company in six different years. Study the graph , carefully and answer the questions that follow. In which year income of the company is the highest?
View SolutionRead the following graph carefully and answer the questions given below. If income of company A in the year 2002 was Rs 20 cr. What is the approximate expenditure of the company in the same year ?
View SolutionRead the following graph carefully and answer the questions given below. If income of company B in the year 2006 is Rs. 28 cr. what is the profit of the company in the same year?
View SolutionRead the following pie and bargraph carefully and answer the questions given below.
Income of seven companies in a state in the year 2001
Total income of all companies = ₹ 3500 cr.
What was expenditure of company F in 2001 ?
View Solution
