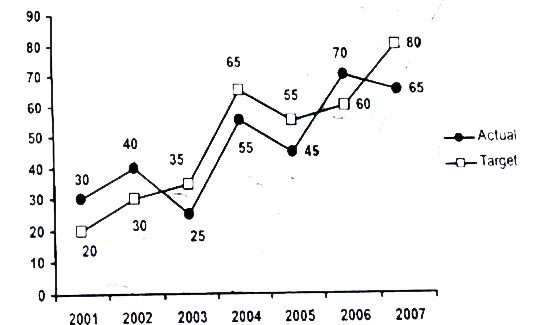
Study the following graph and answer the following questions :-
Following graph shows the actual & target productin of a companry over the period (in thousand tonnes)

the target production in the year 2001, 2003 and 2005 together is what percent of acutal production of 2002, 2004 and 2006 together ?
2613%
3712%
6643%
6623%
The correct Answer is:D
Step by step video & text solution for Study the following graph and answer the following questions :- Following graph shows the actual & target productin of a companry over the period (in thousand tonnes) the target production in the year 2001, 2003 and 2005 together is what percent of acutal production of 2002, 2004 and 2006 together ? by Maths experts to help you in doubts & scoring excellent marks in Class 14 exams.
Updated on:21/07/2023Topper's Solved these Questions
Similar Questions
What will come in place of the question mark (?) in the following questions ?
√11449×√6241−(54)2=√?+(74)2
View SolutionWhat value will come in place of question mark (?) in the questions given below ?
735−425+845=?
View SolutionFrom the following data, using weighted average method, calculate the cost of living index for the year 2006, taking 2002 as the base year.
ltimg src="https://d10lpgp6xz60nq.cloudfront.net/physics_images/PS_MATH_IX_C18_E03_005_Q01.png" width="80%"gt
View SolutionWhich of the following are correct chain isomers of butane ? (i)
View SolutionDetermine the point of symmetry of a regular hexagon.
View SolutionDtermine the images of the following figure about the given line :
View SolutionMatch the following Column A to Column B

View SolutionMatch the following Column A to Column B

View SolutionMatch the following Column A to Column B

View SolutionThe inequation represented by the graph given below is :
View SolutionThe inequation that best describes the graph given below is _________
View SolutionThe inequation that best describes the following graph is _________
View SolutionWhich of the following statement is not correc for following straight line graph :-
ltimg src="https://d10lpgp6xz60nq.cloudfront.net/physics_images/ALN_PHY_R04_E01_015_Q01.png" width="80%"gt
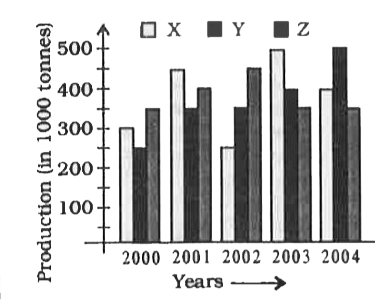
View SolutionThe following graph shows the production of wheat flour (in 1000 tonnes) by three companies X, Y and Z over the years. Study the graph and answer the questions.

What is the percentage Increase in the production of company Y from 2002 to 2003?
View SolutionWhich of the following statement is not correct for following straight line graph :-
ltimg src="https://d10lpgp6xz60nq.cloudfront.net/physics_images/ALN_PHY_R04_E01_015_Q01.png" width="80%"gt
View SolutionConsider the following reactions.
View Solution
