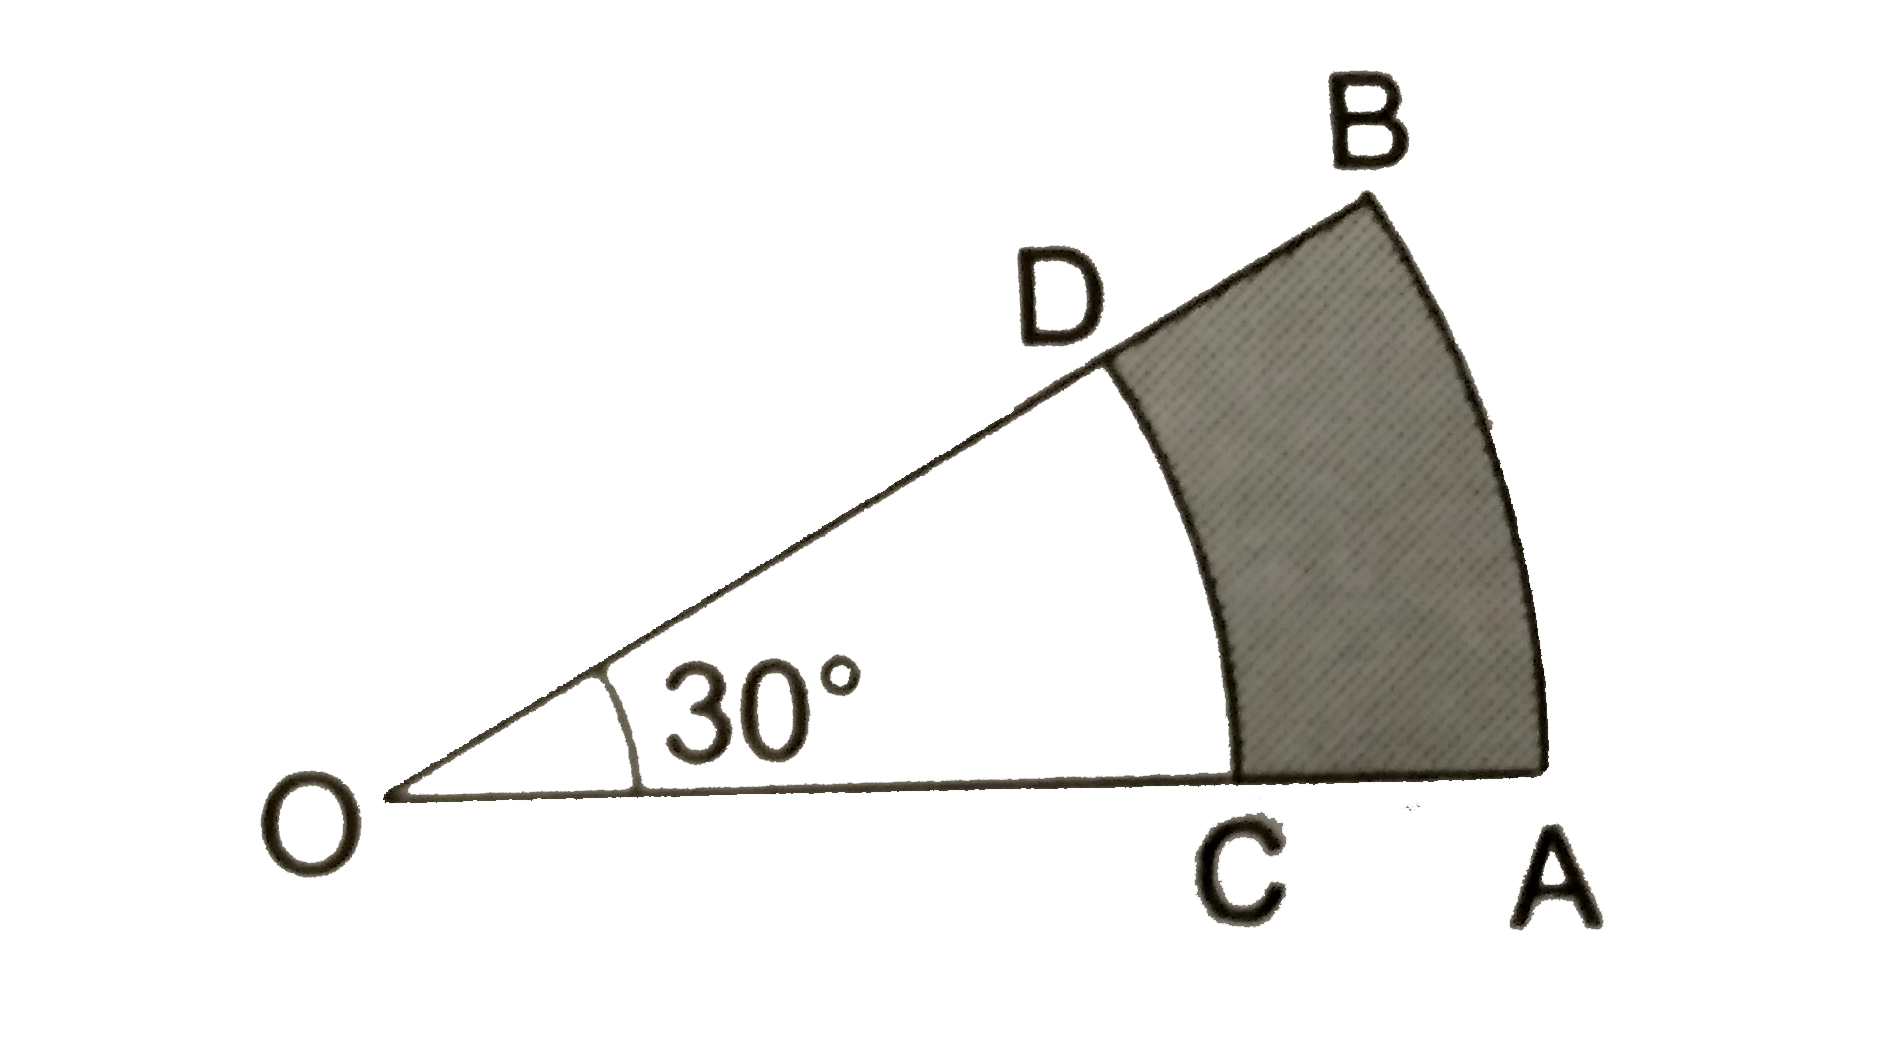
In the give figure, the sectors of two concentric circles of radii 7 cm and 3.5 cm are shown. Find the area of the shaded region.

Step by step video solution for In the give figure, the sectors of two concentric circles of radii 7 cm and 3.5 cm are shown. Find the area of the shaded region. by Maths experts to help you in doubts & scoring excellent marks in Class 10 exams.
Updated on:21/07/2023Topper's Solved these Questions
- SAMPLE PAPER - 6 BOOK - EDUCART PUBLICATIONCHAPTER - SAMPLE PAPER - 6 EXERCISE - PART - B (SECTION - III)
10 Videos
- REAL NUMBERS BOOK - EDUCART PUBLICATIONCHAPTER - REAL NUMBERS EXERCISE - LONG QUESTION TYPE QUESTIONS
5 Videos
- SAMPLE PAPER 12 BOOK - EDUCART PUBLICATIONCHAPTER - SAMPLE PAPER 12 EXERCISE - PART - B (SECTION -V)
4 Videos
Similar Questions
Determine the AP whose 3rdterm is 5 and the 7thterm is 9.
View SolutionShow that the square of any positive integer cannot of the form 5q+2 or 5q+3 for some integer q.
View SolutionThe lower window of a house is at a height of 2 m above the ground and its upper window is 4 m above the lower window. At certain instant, the angles of elevation of a balloon from these windows are observed to be 60∘and30∘ , respectively. Find the height of the balloon from the ground.
View SolutionDetermine the point of symmetry of a regular hexagon.
View SolutionFind the area of the shaded region, given that the radius of each circle is equal to 5 cm.
View SolutionMatch the following Column A to Column B

View SolutionMatch the following Column A to Column B

View SolutionMatch the following Column A to Column B

View SolutionFind the area of figure given below.

View SolutionFind the area of the figure given below.

View SolutionThe area of the shaded part in the figure given below is ______.

View Solution
Find the area of the shaded part in the figure given above.
View SolutionThe inequation represented by the graph given below is :
View SolutionThe inequation that best describes the graph given below is _________
View SolutionThe inequation that best describes the following graph is _________
View SolutionWhich inequations represent the shaded region in the given figure
View Solution
