Direction: The bar graph shown below indicate the number of books owned and the number of books
issued by the 5 different libraries A, B, C, D, and E. Based on the given bar graph answer the question
given below:
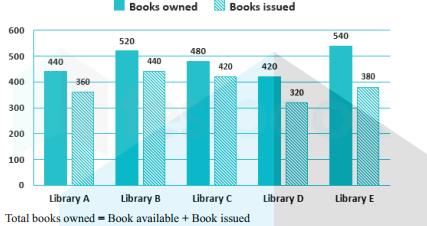
Books available in library A and C together is how much percent more or less than the books
available in library B and E together?
0.3333
0.125
0.25
0.416
Step by step video solution for Direction: The bar graph shown below indicate the number of books owned and the number of books issued by the 5 different libraries A, B, C, D, and E. Based on the given bar graph answer the question given below:Books available in library A and C together is how much percent more or less than the books available in library B and E together? by Maths experts to help you in doubts & scoring excellent marks in Class 14 exams.
Updated on:21/07/2023Similar Questions
Direction: The bar graph shown below indicate the number of books owned and the number of books issued by the 5 different libraries A, B, C, D, and E. Based on the given bar graph answer the question given below:
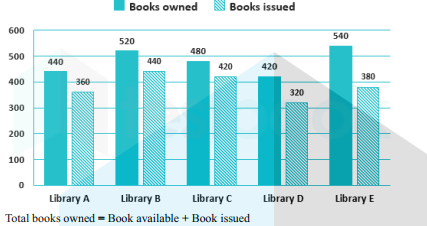
Books available in library E is how much percent of books owned by library B and C together?
View SolutionDirection: The bar graph shown below indicate the number of books owned and the number of books issued by the 5 different libraries A, B, C, D, and E. Based on the given bar graph answer the question given below:
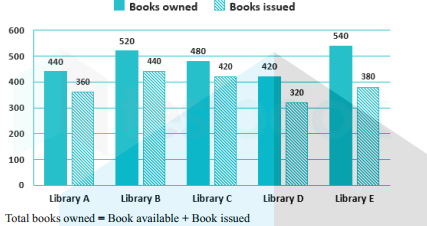
Books available in library D is how much percent of books owned by library B and C together?
View SolutionDirection: The bar graph shown below indicate the number of books owned and the number of books issued by the 5 different libraries A, B, C, D, and E. Based on the given bar graph answer the question given below:
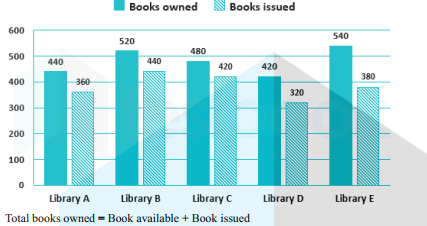
Find the ratio between the books available in library A, C and D together to books available in library B and E together.
View SolutionDirection: The bar graph shown below indicate the number of books owned and the number of books issued by the 5 different libraries A, B, C, D, and E. Based on the given bar graph answer the question given below:
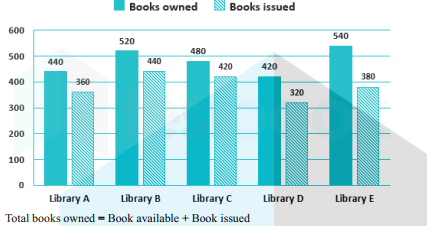
Find the average number of books available in all 5 library.
View SolutionDirection: The bar graph shown below indicate the number of books owned and the number of books issued by the 5 different libraries A, B, C, D, and E. Based on the given bar graph answer the question given below:
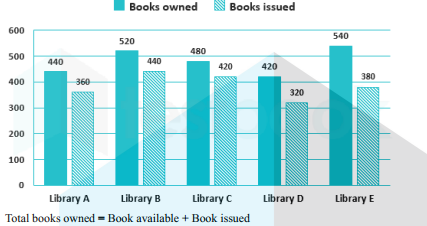
Find the average number of books owned in all 5 library.
View SolutionDirection: The bar graph shown below indicate the number of books owned and the number of books issued by the 5 different libraries A, B, C, D, and E. Based on the given bar graph answer the question given below:
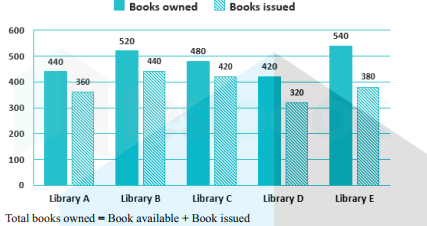
What is the ratio of total books owned by all the libraries together to total books issue by all the libraries together?
View SolutionDirection: The bar graph shown below indicate the number of books owned and the number of books issued by the 5 different libraries A, B, C, D, and E. Based on the given bar graph answer the question given below:
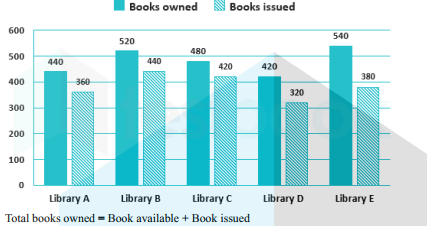
What is the ratio of total books owned by all the libraries together to total books issue by all the libraries together?
View Solution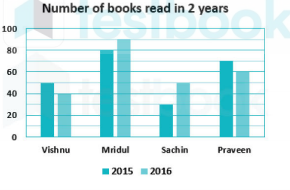
Directions: Read the bar graph carefully and answer the given questions.Books read by Praveen in the year 2015 is what percent more or less than the number of books read by Mridul in the year 2015 ?
View SolutionStudy the following bar graph and answer the questions given below.
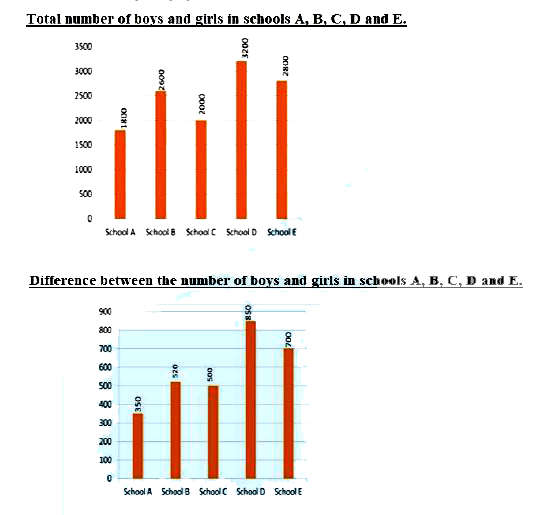
What is the ratio of numbers of boys to the number of girls in school E?
View SolutionDirections: The following bar graph shows the number of pages in five different books (viz. A, B, C, D and E). Study the graph carefully and answer the following questions.
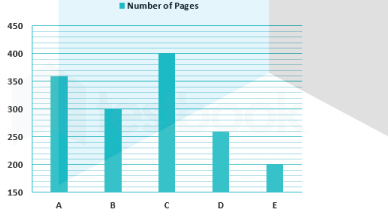
What is the ratio of total number of pages in book B and E together to the total number of pages in book C and D together?
View Solution
