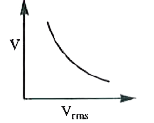
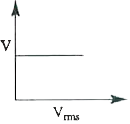
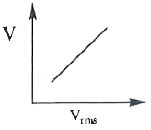
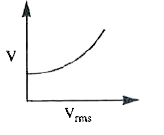
For an ideal gas, the graph representing the variation of the speed of sound (v) in a gas, with the r.m.s. speed (vrms) of its gas molecules with be


The correct Answer is:C
To solve the problem of how the speed of sound (v) in an ideal gas varies with the root mean square speed (v_rms) of its gas molecules, we can follow these steps:
Step 1: Understand the formulas
The root mean square speed (v_rms) of gas molecules is given by the formula:
vrms=√3RTM
where:
- R is the universal gas constant,
- T is the absolute temperature in Kelvin,
- M is the molar mass of the gas.
The speed of sound (v_s) in an ideal gas is given by:
vs=√γRTM
where:
- γ is the adiabatic index (ratio of specific heats, Cp/Cv).
Step 2: Relate the two speeds
To find the relationship between vrms and vs, we can divide the two equations:
vrmsvs=√3RTM√γRTM
In this expression, R, T, and M will cancel out:
vrmsvs=√3γ
Step 3: Express vrms in terms of vs
From the above relationship, we can express vrms in terms of vs:
vrms=vs⋅√3γ
This shows that vrms is directly proportional to vs.
Step 4: Graphical representation
Since vrms is proportional to vs, we can represent this relationship graphically. If we let vrms be on the x-axis and vs be on the y-axis, the equation can be rearranged to:
vs=1√3γvrms
This is a linear equation of the form y=mx, where m is a constant. Therefore, the graph will be a straight line passing through the origin.
Conclusion
The graph representing the variation of the speed of sound (v) in a gas with the root mean square speed (v_rms) of its gas molecules will be a straight line.
The root mean square speed (v_rms) of gas molecules is given by the formula:
vrms=√3RTM
where:
- R is the universal gas constant,
- T is the absolute temperature in Kelvin,
- M is the molar mass of the gas.
vs=√γRTM
where:
- γ is the adiabatic index (ratio of specific heats, Cp/Cv).
To find the relationship between vrms and vs, we can divide the two equations:
vrmsvs=√3RTM√γRTM
In this expression, R, T, and M will cancel out:
vrmsvs=√3γ
From the above relationship, we can express vrms in terms of vs:
vrms=vs⋅√3γ
This shows that vrms is directly proportional to vs.
Since vrms is proportional to vs, we can represent this relationship graphically. If we let vrms be on the x-axis and vs be on the y-axis, the equation can be rearranged to:
vs=1√3γvrms
This is a linear equation of the form y=mx, where m is a constant. Therefore, the graph will be a straight line passing through the origin.
The graph representing the variation of the speed of sound (v) in a gas with the root mean square speed (v_rms) of its gas molecules will be a straight line.
Topper's Solved these Questions
- WAVESBook:AAKASH SERIESChapter:WAVESExercise:EXERCISE-II (Pipes)
Explore 13 Videos
- WAVESBook:AAKASH SERIESChapter:WAVESExercise:EXERCISE-II (Beats : )
Explore 20 Videos
- WAVESBook:AAKASH SERIESChapter:WAVESExercise:EXERCISE-II (Strings (Speed of a travelling wave:))
Explore 23 Videos
- WAVE OPTICSBook:AAKASH SERIESChapter:WAVE OPTICSExercise:PROBLEMS (LEVEL - II)
Explore 33 Videos
- WAVES OPTICSBook:AAKASH SERIESChapter:WAVES OPTICSExercise:EXERCISE -III (POLARISITION)
Explore 10 Videos
Similar Questions
An open organ pipe sounds a fundamental note of frequency 330 Hz. If the speed in air is 330 m/s then the length of the pipe is nearly
View SolutionTwo vibrating tunign forks produce progessive waves given by
y1=4sin500πtandy22sin506πt.
Number of beat produced pre minture is .
View SolutionThe length of a string attached to two rigid supports is 40 cm. The maximum wavelength in cm of a stationary wave produced on it is :
View SolutionIn Young's double-slit experiment, the y-coordinate of central maxima and 10th maxima are 2 cm and 5 cm, respectively, When the YDSE apparatus is immersed in a liquid of refractive index 1.5, the corresponding y-coordinates will be
View SolutionA ray of light is incident on the surface of a glass plate of refractive index √3 at the polarising angle . The angle of incidence and angle of refraction of the ray is
View Solutionr.m.s speed of ideal gas at 127^(@)C is 200m//s the rms. Speed of same ideal gas at temperature 227^(@)C is
View SolutionExplain why the speed of sound through a gas cannot be greater than the r.m.s. speed of the molecules of the gas.
View SolutionIf c is r.m.s speed of molecules in a gas and upsilon is the speed of sound waves in the gas, show that c//upsilon is contant and independent of temperature for all diatomic gases.
View SolutionIf v_(rms) is the rms speed of molecules in a gas and v is the speed of sound waves in the gas, then the ratio (v_(rms))/v is
View SolutionAt what temperature, the r.m.s. speed of the molecules of a gas is half its value at NTP?
View Solutionr.m.s speed of ideal gas at 127∘C is 200m/s the rms. Speed of same ideal gas at temperature 227∘C is
View SolutionFor an ideal gas, the graph representing the variation of the speed of sound (v) in a gas, with the r.m.s. speed (vrms) of its gas molecules with be
View SolutionThe r.m.s speed of the molecules of a gas in a vessel is 400 ms−1. If half of the gas leaks out, at constant temperature, the r.m.s speed of the remaining molecules will be
View SolutionIf v_(rms) is the rms speed of molecules in a gas and v is the speed of sound waves in the gas, then the ratio (v_(rms))/v is
View SolutionThe r.m.s. speed of the molecules of a gas at 100∘C is v. The temperature at which the r.m.s. speed will be √3v is
View SolutionThe r.m.s speed of the molecules of a gas at 100^(@)C is v. The temperature at which the r.m.s speed will be sqrt3v is
View Solution
