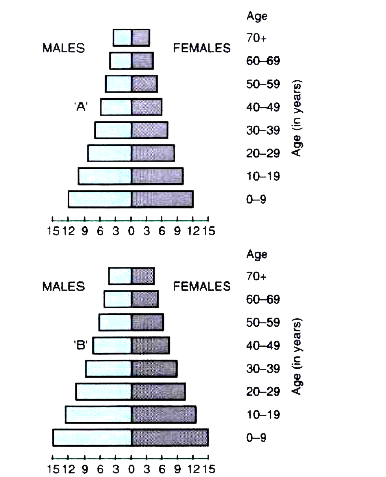
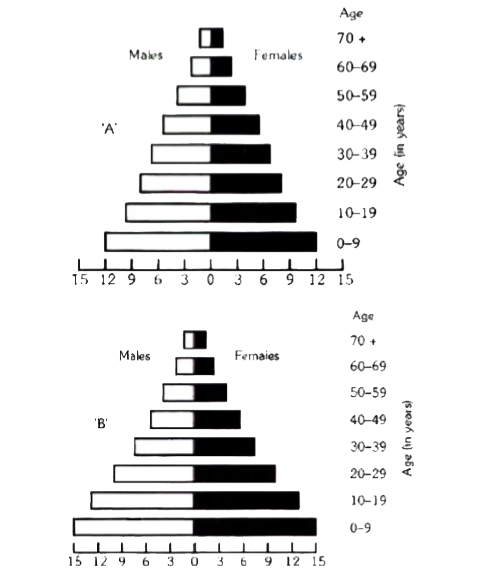
A country with a high rate of population growth took measures to reduce it. The figure below shows are sex pyramids of populations. A and B twenty years apart. Select the correct interpretation about them.

Interpretations
"A" is the earlier pyramid and no change has occurred in the growth rate
"A" is more recent shows slight reduction in the growth rate
B is earlier pyramid and shows stabilized growth rate
B is more recent showing that population is very young
The correct Answer is:B
Step by step video solution for A country with a high rate of population growth took measures to reduce it. The figure below shows are sex pyramids of populations. A and B twenty years apart. Select the correct interpretation about them. Interpretations by Biology experts to help you in doubts & scoring excellent marks in Class 12 exams.
Updated on:21/07/2023Topper's Solved these Questions
- ORGANISMS AND POPULATIONSBook:AAKASH SERIESChapter:ORGANISMS AND POPULATIONSExercise:EXERCISE-II (POPULATION INTERACTIONS)
Explore 1 Video
- NEURAL CONTROL AND COORDINATIONBook:AAKASH SERIESChapter:NEURAL CONTROL AND COORDINATIONExercise:EXERCISE-III( PREVIOUS AIPMT / NEET QUESTIONS)
Explore 33 Videos
- PHOTOSYNTHESIS IN HIGHER PLANTS Book:AAKASH SERIESChapter:PHOTOSYNTHESIS IN HIGHER PLANTS Exercise:Exercise - III
Explore 27 Videos
Similar Questions
If a organism's body pattern resembles its environment making it difficult to spot, it is called as
View SolutionReceptor sites for neurotransmitters are present on
View SolutionPhosphoenol pyruvate (PEP) is the primary CO2 acceptor in
View SolutionA country with a high rate of population growth took measures to reduce it. The figure below shows age-sex pyramids of populations "A" and "B" twenty years apart. Select the correct interpretation about them Interpretations:
View SolutionA country with a high rate of population growth took measures to reduce it. The figure below shows age sex pyramids of populations. A and B twenty years apart. Select the correct interpretation about them
View SolutionA country with a high rate of population growth took measures to reduce it. The figure below shows agesex pyramids of populations A and B twenty years apart. Select the correct interpretation about them:

View Solutionএকটি দেশের জনসংখ্যা 50 বছরে দ্বিগুণ হয়। যদি জনসংখ্যা বৃদ্ধির হার অধিবাসী সংখ্যার সঙ্গে সমানুপাতী হয়, তবে কতবছরে জনসংখ্যা তিনগুণ হবে?
View SolutionWHICH COUNTRY HAS HIGH POPULATION GROWTH RATE
View Solutionदिये गये चित्र के सन्दर्भ में सही विकल्प चुनिये :
View SolutionA country with a high rate of population growth took measures to reduce it. The figure below shows age- sex pyramid of populations A and B twenty years apart. Select the correct interpretation about them.


View SolutionThe births and deaths of four populations A, B, C and D in a year are given below. Which population has the highest growth rate?
View SolutionA country with a high rate of population growth took measures to reduce it. The figures shows age-sex pyramids of populations A and B twenty years apart. Select the correct interpretation about them:
View SolutionA country with a high rate of population growth took measures to reduce it. The figure below shows are sex pyramids of populations. A and B twenty years apart. Select the correct interpretation about them. Interpretations
View SolutionGiven below are hypothetical figures in regard to population (in crores) of two countries X and Y during the last three decades. From the above data complete the following sentences : (i) Rate of growth of population of country ............. has declined between years ............. and .............. (ii) the country ........... shows negative population growth between years .......... and ............ (iii) The country ............ shows positive population growth between years ......... and .......... .
View SolutionPopulation || Local Population and Sister Population || Characteristics OF Population ||Birth Rate || Death Rate || Immigration || Emigration ||Population Growth ||Age Pyramids || Population Density
View SolutionA country with a high rate of population growth took measures to reduce it. The figure below shows age-sex pyramids of populations A and B twenty years apart. Select the correct interpretation about them
View Solution
