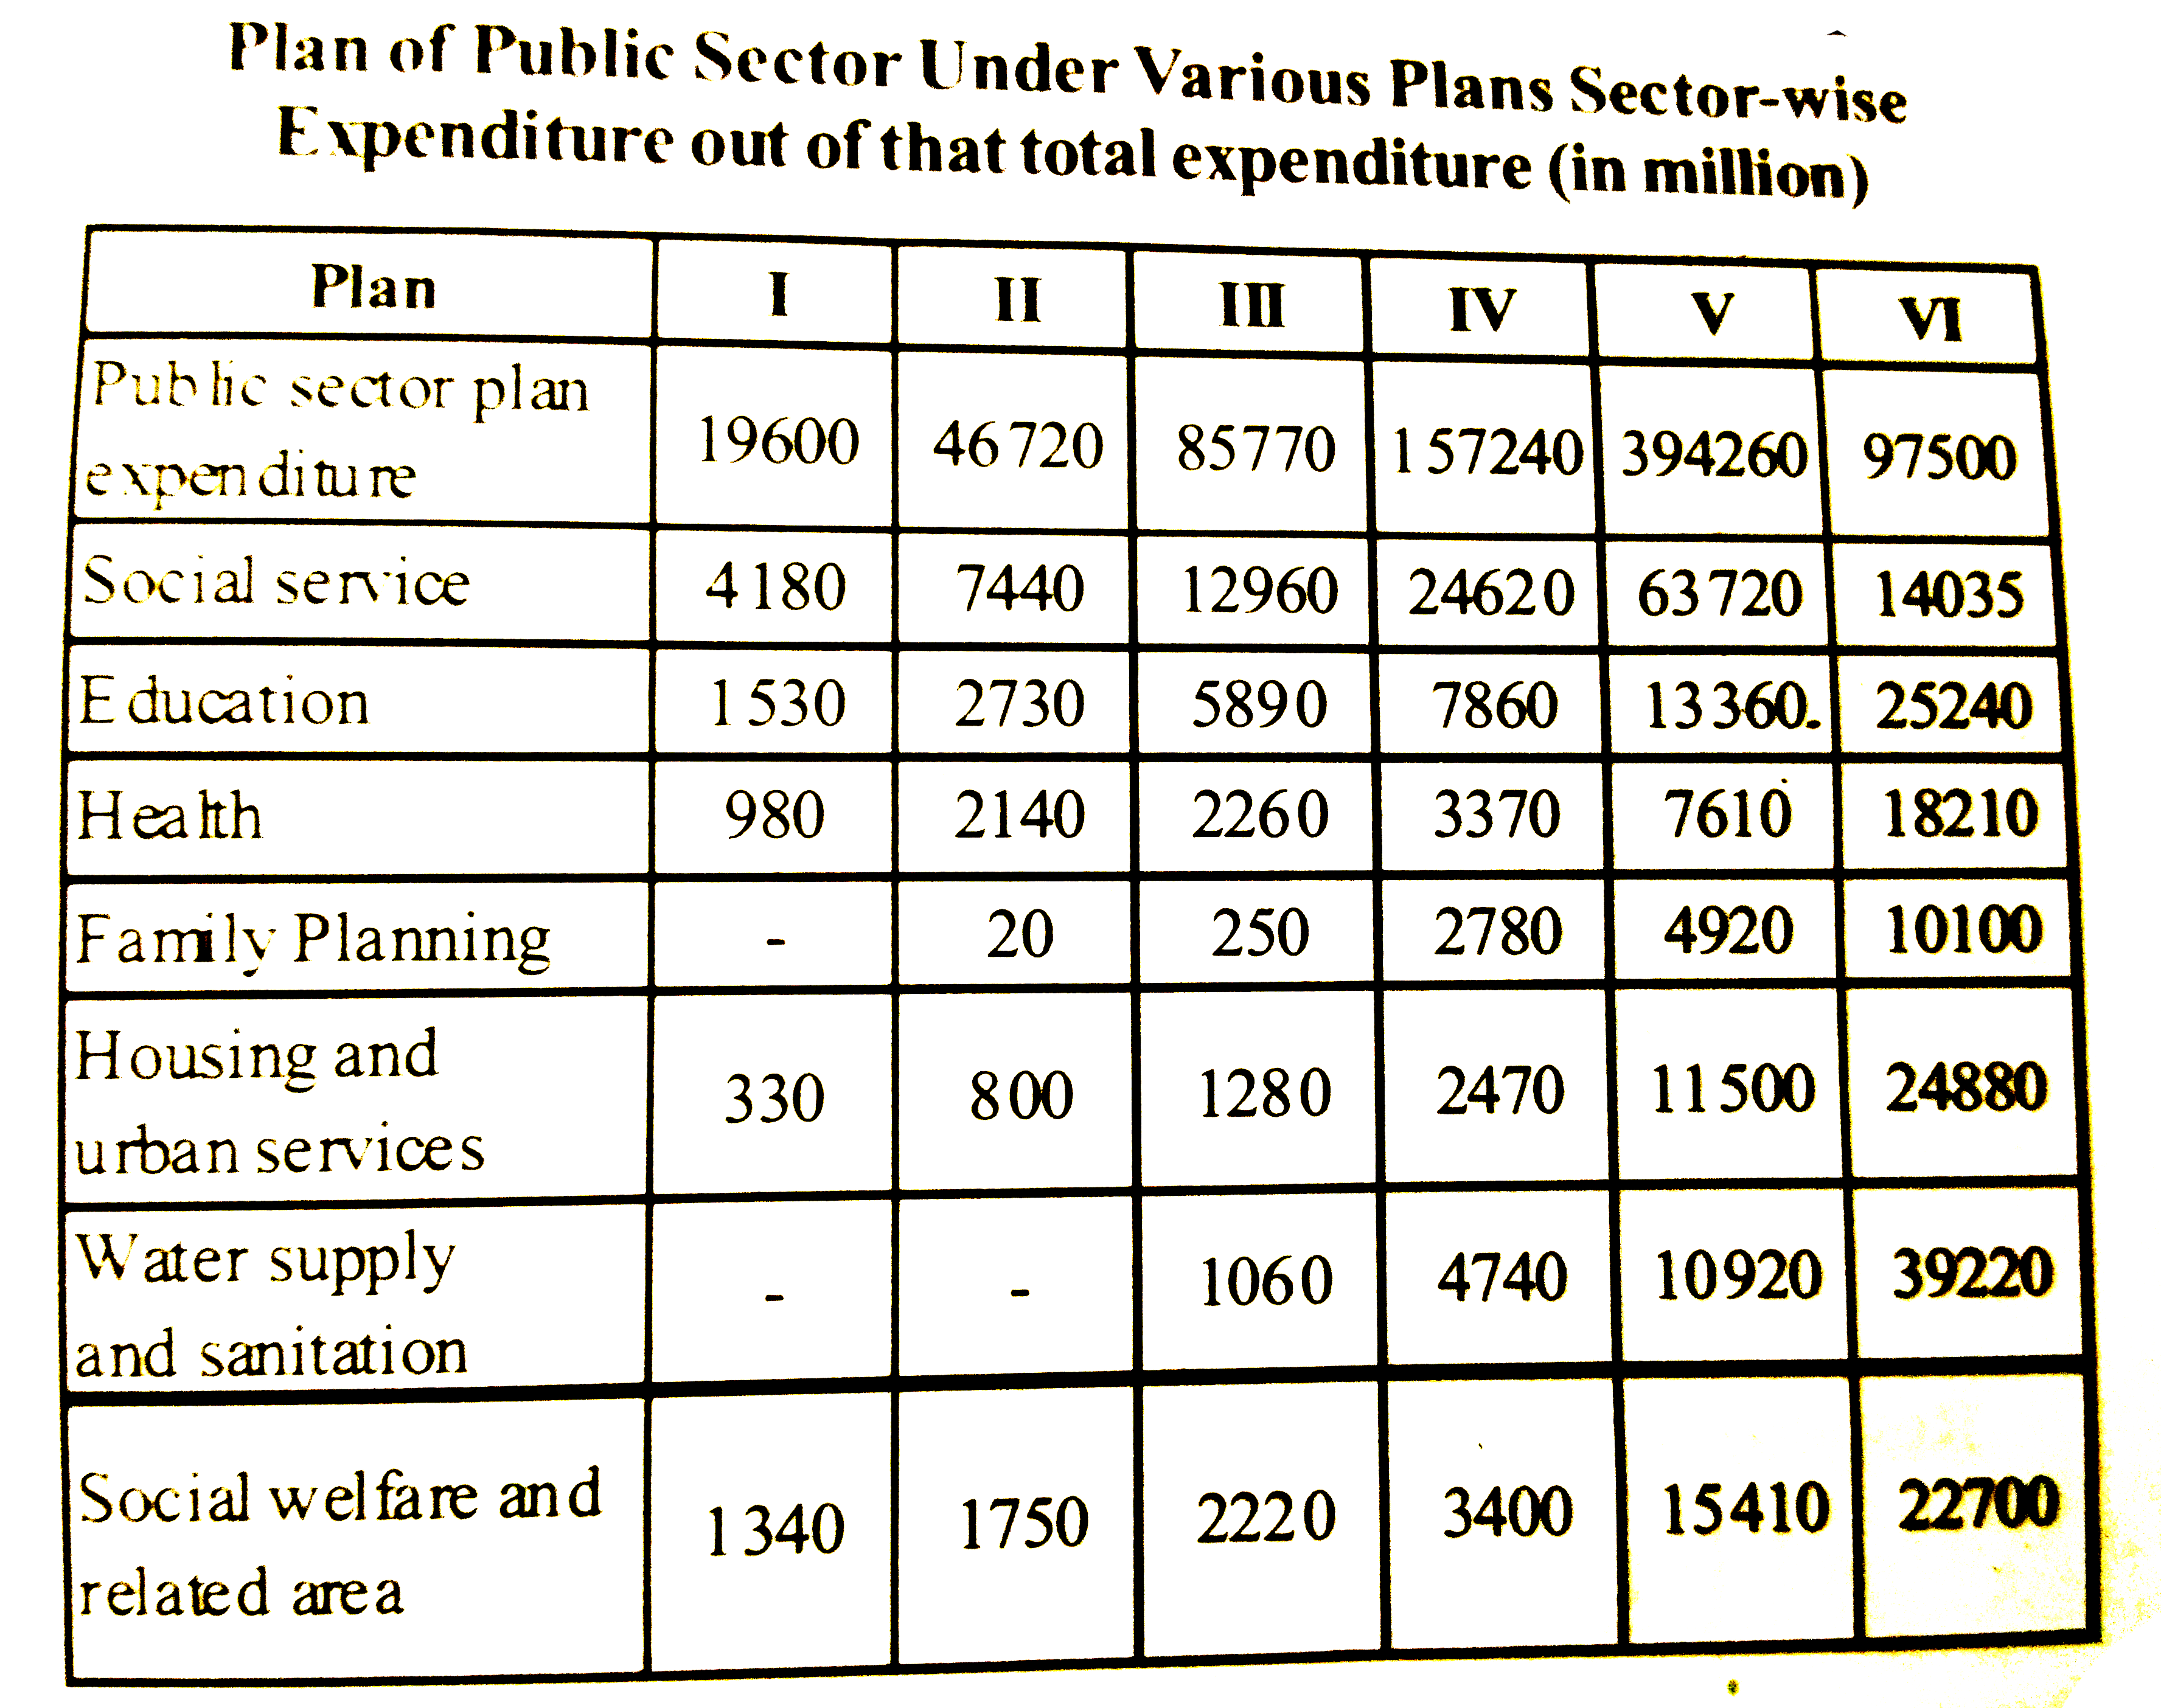
Each of the questions is based on the table given below -----
What was the total difference of expenditure in Education and Health for all planning ?
Rs. 220400000
Rs.224000000
Rs.22040000000
Rs. 220400000000
The correct Answer is:C
Topper's Solved these Questions
Similar Questions
If log3a=4, find value of a.
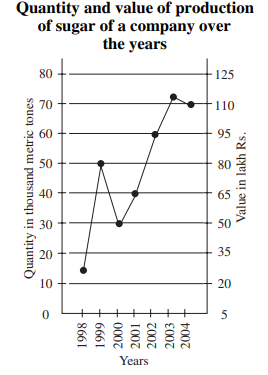
View SolutionStudy the following graph carefully and answer the questions given below –

What was the difference between the average production of sugar during the average production of sugar during the year 1998, 1999, 2000 and 2001 and that of 2001, 2002, 2003 and 2004 in thousand metric tons?
View SolutionFrom the total expenditure , expenditure on education is 20%. What is the measure of the central angle of expenditure on education to show in the pie diagram?
View Solution
For all the given plans, what was the difference in expenditure on education and health ?
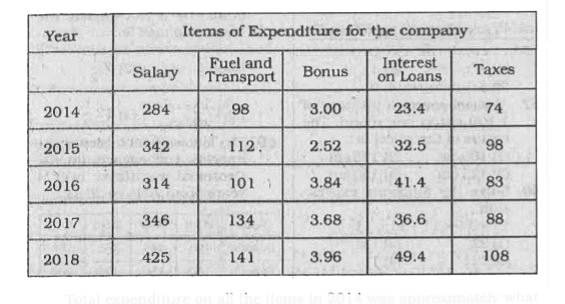
View SolutionStudy the following table and answer the question. Expenditures of a Company in Lakh Rupees) per annum over the given years.

Total expenditure on all the items in 2014 was approximately what percent of the total expenditure in 2018?
View SolutionFrom the total expenditure , expenditure on education is 20%. What is the measure of the central angle of expenditure on education to show in the pie diagram?
View SolutionThe following table shows the distribution of expenditure on education of different families. Calculate the mean expenditure of education of the family.
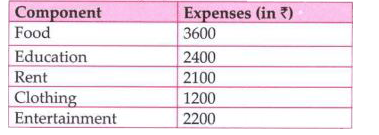
View SolutionThe table given below shows the expenditures on different component of a person. What was the total expenditure of the person?

View SolutionIn the given pie-chart, the total expenditure on rent and education is what percent less than the total expenditure on food and miscellaneous expenses?
View SolutionStudy the following graph carefully to answer the questions given below. Expenditure in lakhs) of three different Companies in Five Different Years In which year was the total expenditure by all the three companies together second highest?
View SolutionStudy the following graph carefully to answer the questions given below. Expenditure in lakhs) of three different Companies in Five Different Years Total expenditure of all the three companies together in the year 2006 was what Percentage of the total expenditure of Company A over all the years together?
View SolutionStudy the following table and answer the questions based on it. Below is the Household is Expenditure (in Thousand Rupees) per annum What is the total Houshold Expenditure for the year 2012
View SolutionThe following pie chart shows percentage expenditure of a country on different heads .The total expenditure is Rs. 1,680 (in billions).Study the chart and answer the question. The total amount of expenditure for education and Health (in billions Rs. )is:
View SolutionThe following pie chart shows percentage expenditure of a country on different heads .The total expenditure is Rs. 1.680 (in billions ). Study chart and answer the question . The amount of expenditure on Defence is what percentage more than the expenditure on Education ?
View SolutionStudy the following table and answer the question. Expenditures of a company (in Lakh Rupees) per annum over the given Years. Total expenditures on all the items in 2014 was approximately what percent of the total expenditures in 2018?
View SolutionRead the following the bar graph in fig. and answer the following questions What was the expenditure on health and family planning in the year 2012-13?
View Solution
