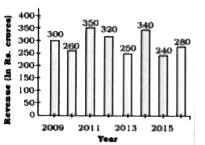
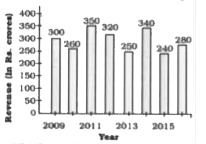
In which year the firm has shown maximum percentage increase in its revenue with respect to the previous year?
2011
2014
2016
All are equal
The correct Answer is:B
To determine the year in which the firm showed the maximum percentage increase in its revenue with respect to the previous year, we will follow these steps:
Step 1: Gather Revenue Data
We need to extract the revenue data from the bar graph for the years provided. The revenue figures are as follows:
- 2009: 300 crore
- 2010: 260 crore
- 2011: 350 crore
- 2012: 320 crore
- 2013: 250 crore
- 2014: 340 crore
- 2015: 360 crore
- 2016: 370 crore
Step 2: Calculate Percentage Increase for Each Year
We will calculate the percentage increase in revenue for each year compared to the previous year using the formula:
Percentage Increase=(Revenue in Current Year−Revenue in Previous YearRevenue in Previous Year)×100
Step 3: Calculate for Each Year
1. From 2009 to 2010:
Percentage Increase=(260−300300)×100=(−40300)×100=−13.33%
2. From 2010 to 2011:
Percentage Increase=(350−260260)×100=(90260)×100≈34.62%
3. From 2011 to 2012:
Percentage Increase=(320−350350)×100=(−30350)×100≈−8.57%
4. From 2012 to 2013:
Percentage Increase=(250−320320)×100=(−70320)×100≈−21.88%
5. From 2013 to 2014:
Percentage Increase=(340−250250)×100=(90250)×100=36%
6. From 2014 to 2015:
Percentage Increase=(360−340340)×100=(20340)×100≈5.88%
7. From 2015 to 2016:
Percentage Increase=(370−360360)×100=(10360)×100≈2.78%
Step 4: Identify Maximum Percentage Increase
Now, we will compare all the calculated percentage increases:
- 2009 to 2010: -13.33%
- 2010 to 2011: 34.62%
- 2011 to 2012: -8.57%
- 2012 to 2013: -21.88%
- 2013 to 2014: 36%
- 2014 to 2015: 5.88%
- 2015 to 2016: 2.78%
The maximum percentage increase is 36% from 2013 to 2014.
Conclusion
The year in which the firm showed the maximum percentage increase in its revenue with respect to the previous year is 2014.
---
We need to extract the revenue data from the bar graph for the years provided. The revenue figures are as follows:
- 2009: 300 crore
- 2010: 260 crore
- 2011: 350 crore
- 2012: 320 crore
- 2013: 250 crore
- 2014: 340 crore
- 2015: 360 crore
- 2016: 370 crore
We will calculate the percentage increase in revenue for each year compared to the previous year using the formula:
1. From 2009 to 2010:
Percentage Increase=(260−300300)×100=(−40300)×100=−13.33%
Percentage Increase=(350−260260)×100=(90260)×100≈34.62%
Percentage Increase=(320−350350)×100=(−30350)×100≈−8.57%
Percentage Increase=(250−320320)×100=(−70320)×100≈−21.88%
Percentage Increase=(340−250250)×100=(90250)×100=36%
Percentage Increase=(360−340340)×100=(20340)×100≈5.88%
Percentage Increase=(370−360360)×100=(10360)×100≈2.78%
Now, we will compare all the calculated percentage increases:
- 2009 to 2010: -13.33%
- 2010 to 2011: 34.62%
- 2011 to 2012: -8.57%
- 2012 to 2013: -21.88%
- 2013 to 2014: 36%
- 2014 to 2015: 5.88%
- 2015 to 2016: 2.78%
The year in which the firm showed the maximum percentage increase in its revenue with respect to the previous year is 2014.
Similar Questions
In which year, the percentage increase in students in school B is the highest in comparison to its previous year
View SolutionIn which year the percentage increase of students in school A is the highest in comparison to its previous years?
View SolutionIn which year the percentage increases in the number of total students in schools A and B taken together is the highest in comparison to its previous years
View SolutionThe given bar graph presents the results in terms of number of students in a school for the five academic year 2013-2014 to 2017-2018.

In which year the percentage increase in the total number of students is the highest in a comparison to the previous academic year?
View SolutionIn which year is the percentage increase in revenue between 5% and 8% over its previous year?
View SolutionThe bar graph given below represents the revenue of a firm for 8 years. All the revenue figures have been shown in terms of Rs. crores.

By what percentage has the revenue of the firm decreased in 2010 with respect to the last year ?
View SolutionThe bar graph given below represents the revenue of a firm for 8 years. All the revenue figures have been shown in terms of Rs. crores.

In which year the firm has shown maximum percentage with respect to the previous year ?
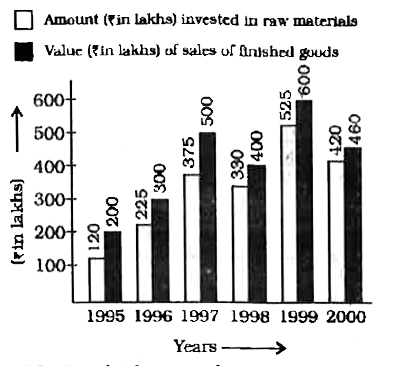
View SolutionStudy the following graph and answer the given questions

In which year, there has been a maximum percentage increase in the amount invested in raw materials as compared to the previous year ?
View Solution
