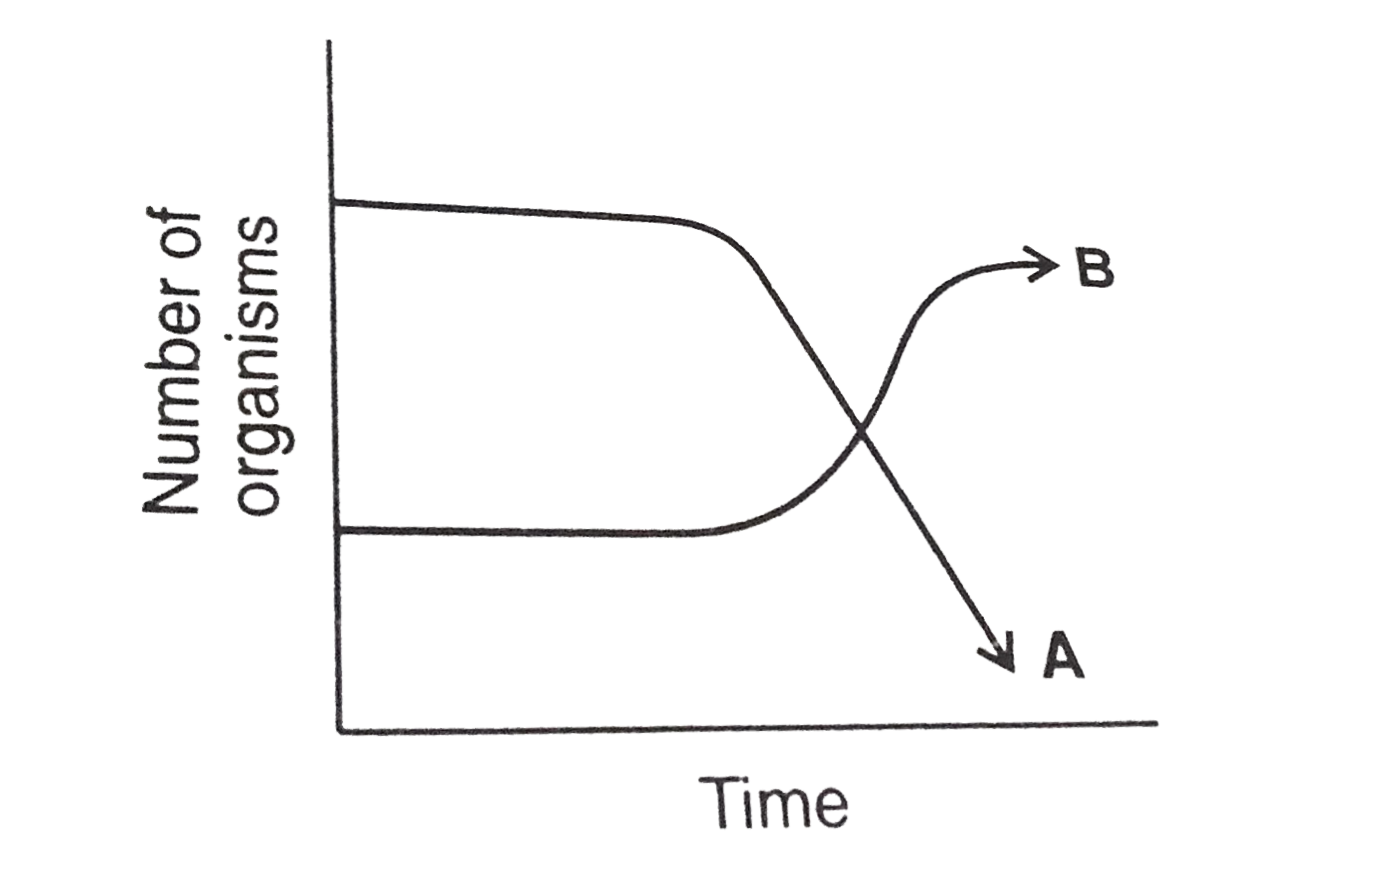
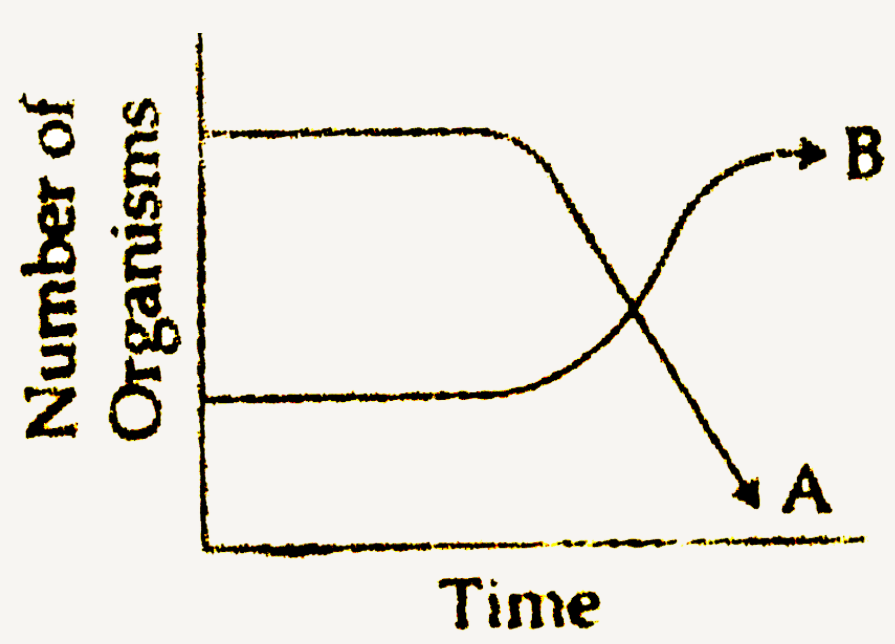
The following graph depicts changes in two populations (A and B) of herbivores in a grassy field. A possible reason for these changes is that :
both plant populations in this habitat decreascd
population-B competed more successfully for food than population-A
population-A produced more offspring than population-B
population-A consumed the members of population-B
The correct Answer is:B
Step by step video & image solution for The following graph depicts changes in two populations (A and B) of herbivores in a grassy field. A possible reason for these changes is that : by Biology experts to help you in doubts & scoring excellent marks in Class 12 exams.
Updated on:21/07/2023Topper's Solved these Questions
- BIODIVERSITY AND ITS CONSERVATION Book:ARIHANT NEETChapter:BIODIVERSITY AND ITS CONSERVATION Exercise:Section-B(Medical entrances special format questions)
Explore 13 Videos
- BASIC CONCEPTS OF IMMUNOLOGYBook:ARIHANT NEETChapter:BASIC CONCEPTS OF IMMUNOLOGYExercise:Medical entrances gallery
Explore 77 Videos
- BIOLOGICAL CLASSIFICATIONBook:ARIHANT NEETChapter:BIOLOGICAL CLASSIFICATIONExercise:Chapter Exercises C Medical entrances gallery (Collection of Questions asked in NEET & Various Medical Entrance Exams )
Explore 21 Videos
Similar Questions
Choose the correct statements.
I. WWF was established in 1961 at gland.
II. Giant panda is symbol of the WWF
III. WWF has be renamed as World Wonder Fund for Nature (WFN)
IV. WWF was founded in 1969 in India.
View SolutionAsthma may be attributed to
View SolutionGreen phytoplankton are kept in which kingdom of five kingdom classification system
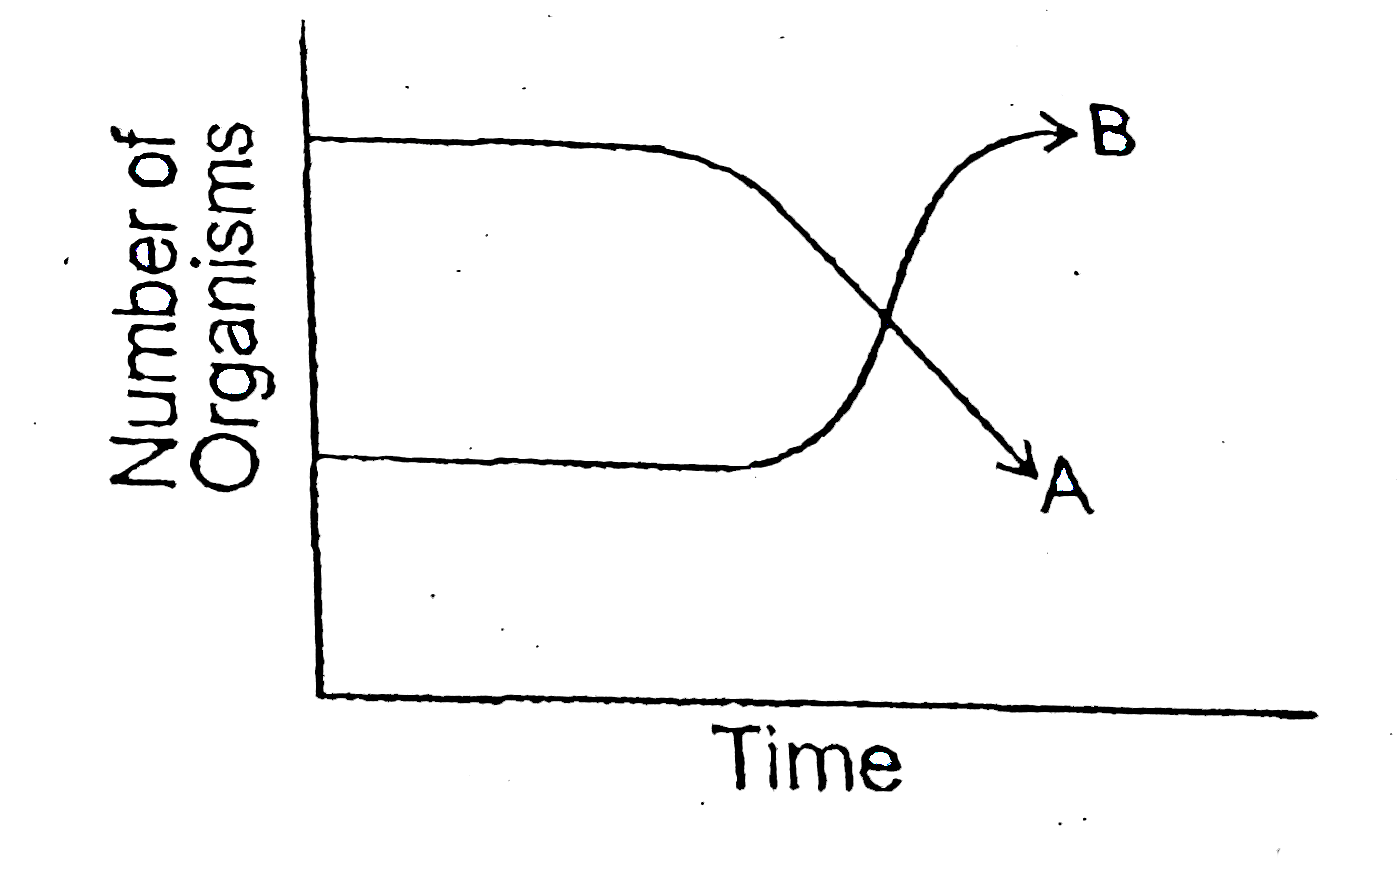
View SolutionThe following graph depicts changes in two populations (A and B) of herbivores in a grassy field. A possible reason for these changes is that :

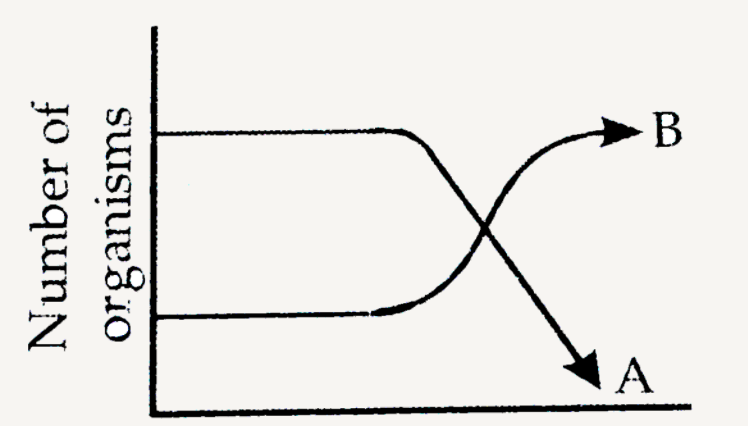
View SolutionThe graph below shows the changes in two populations of herbivores in a grassy field. A possible reason for these changes is that

View SolutionThe following graph depicts changes in two populations (A and B) of herbivores in a grassy field. A possible reason for these changes is that
View SolutionWhich of the following graphs best depicts the changes in one cycle of PCR ?
View Solutionनिम्नलिखित ग्राफ एक घासीय मैदान में शाकाहारियों समष्टियों ( और ) में होने वाले परिवर्तनों को बताता है परिवर्तनों का सम्भावी कारण है कि
View Solutionनिम्नलिखत ग्राफ एक घासीय मैदान में शाकाहारयों की दो | समष्टियों (A और B) में होने वाले परिवर्तनों को बताता हैं। इन परिवर्तनों का संभावी कारण है कि :
View SolutionThe following graph depicts changes in two populations (A and B) of herbivores in a grassy field. A possible reson for these changes is that
View SolutionThe following graph depicts changes in two populations (A and B) of herbivores in a grassy field A possible reason for these changes is that
View SolutionThe following graph depicts changes in two populations A and B of herbivores in a grassy field. A possible reason for these changes is that
View SolutionThe following graph depicts changes in two populations (A and B) of herbivores in a grassy field. A possible reason for these changes is that

View SolutionThe following graph depicts changes in two populations (A and B) of herbivores in a grassy field. A possible reason for these changes is that

View SolutionThe following graph depicts changes in two populations (A and B) of herbivores in a grassy field. A possible reson for these changes is that

View SolutionThe following graph depicts changes in two populations (A and B) of herbivores in a grassy field A possible reason for these changes is that

View Solution
