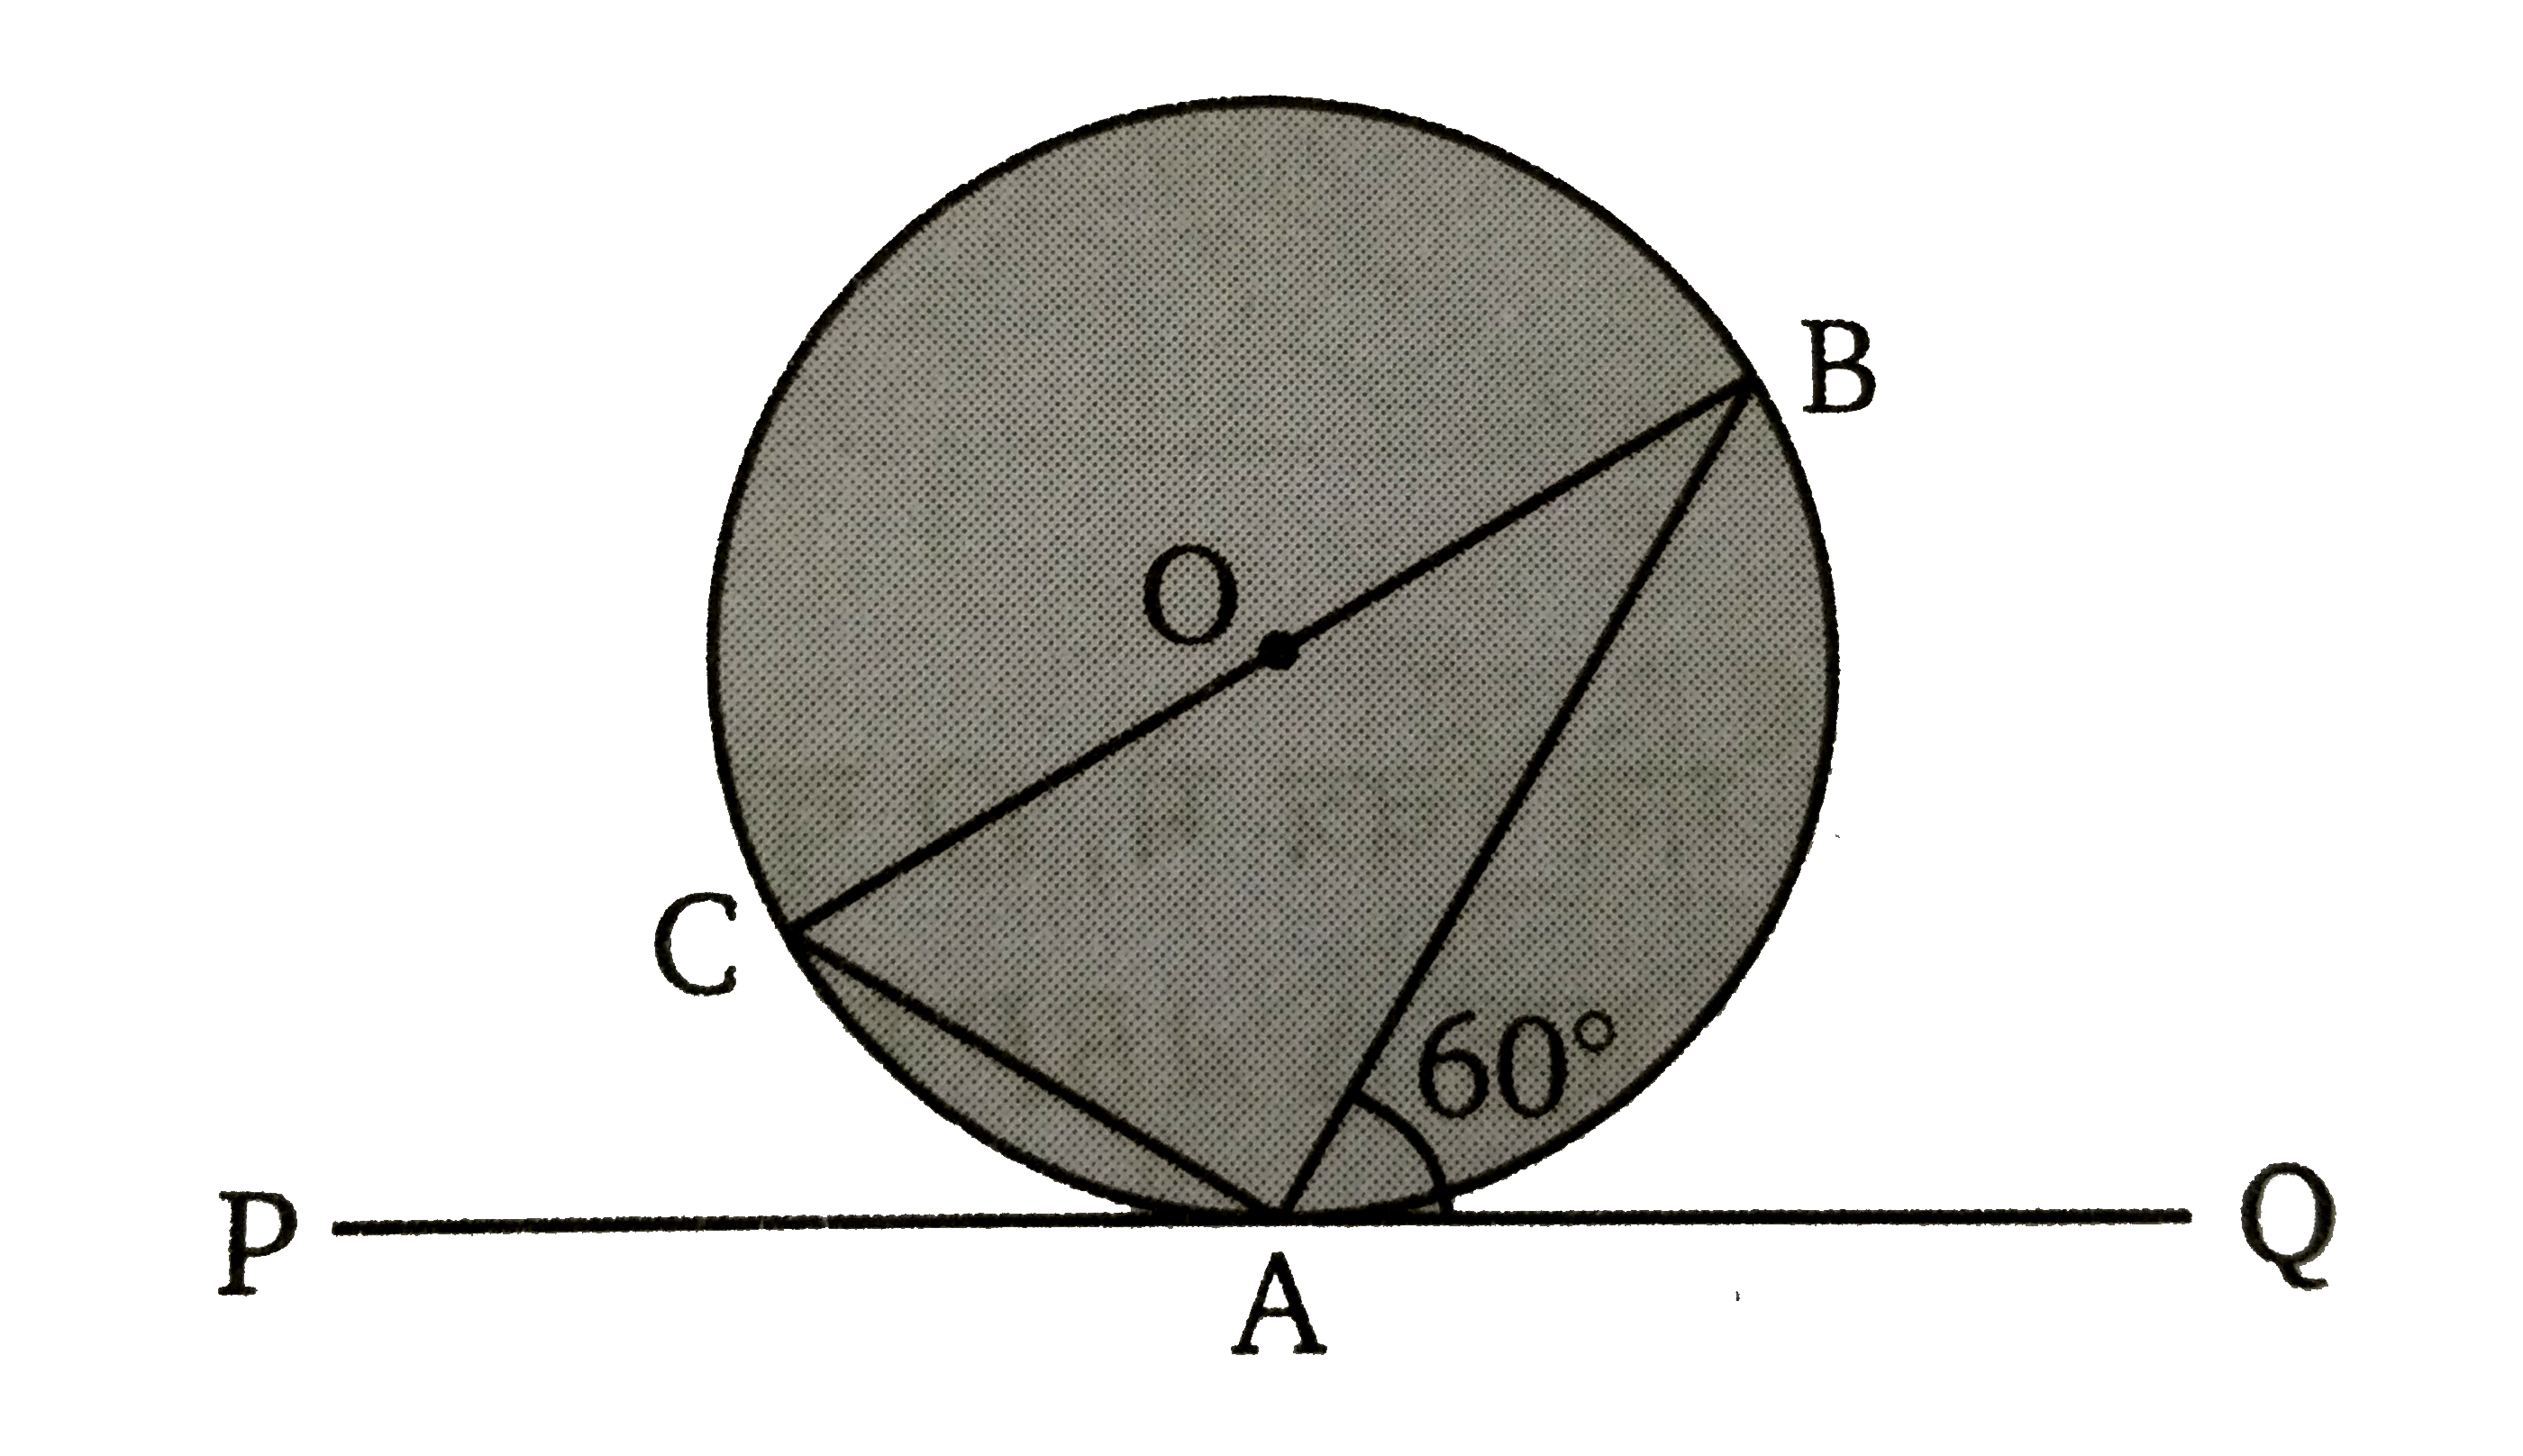
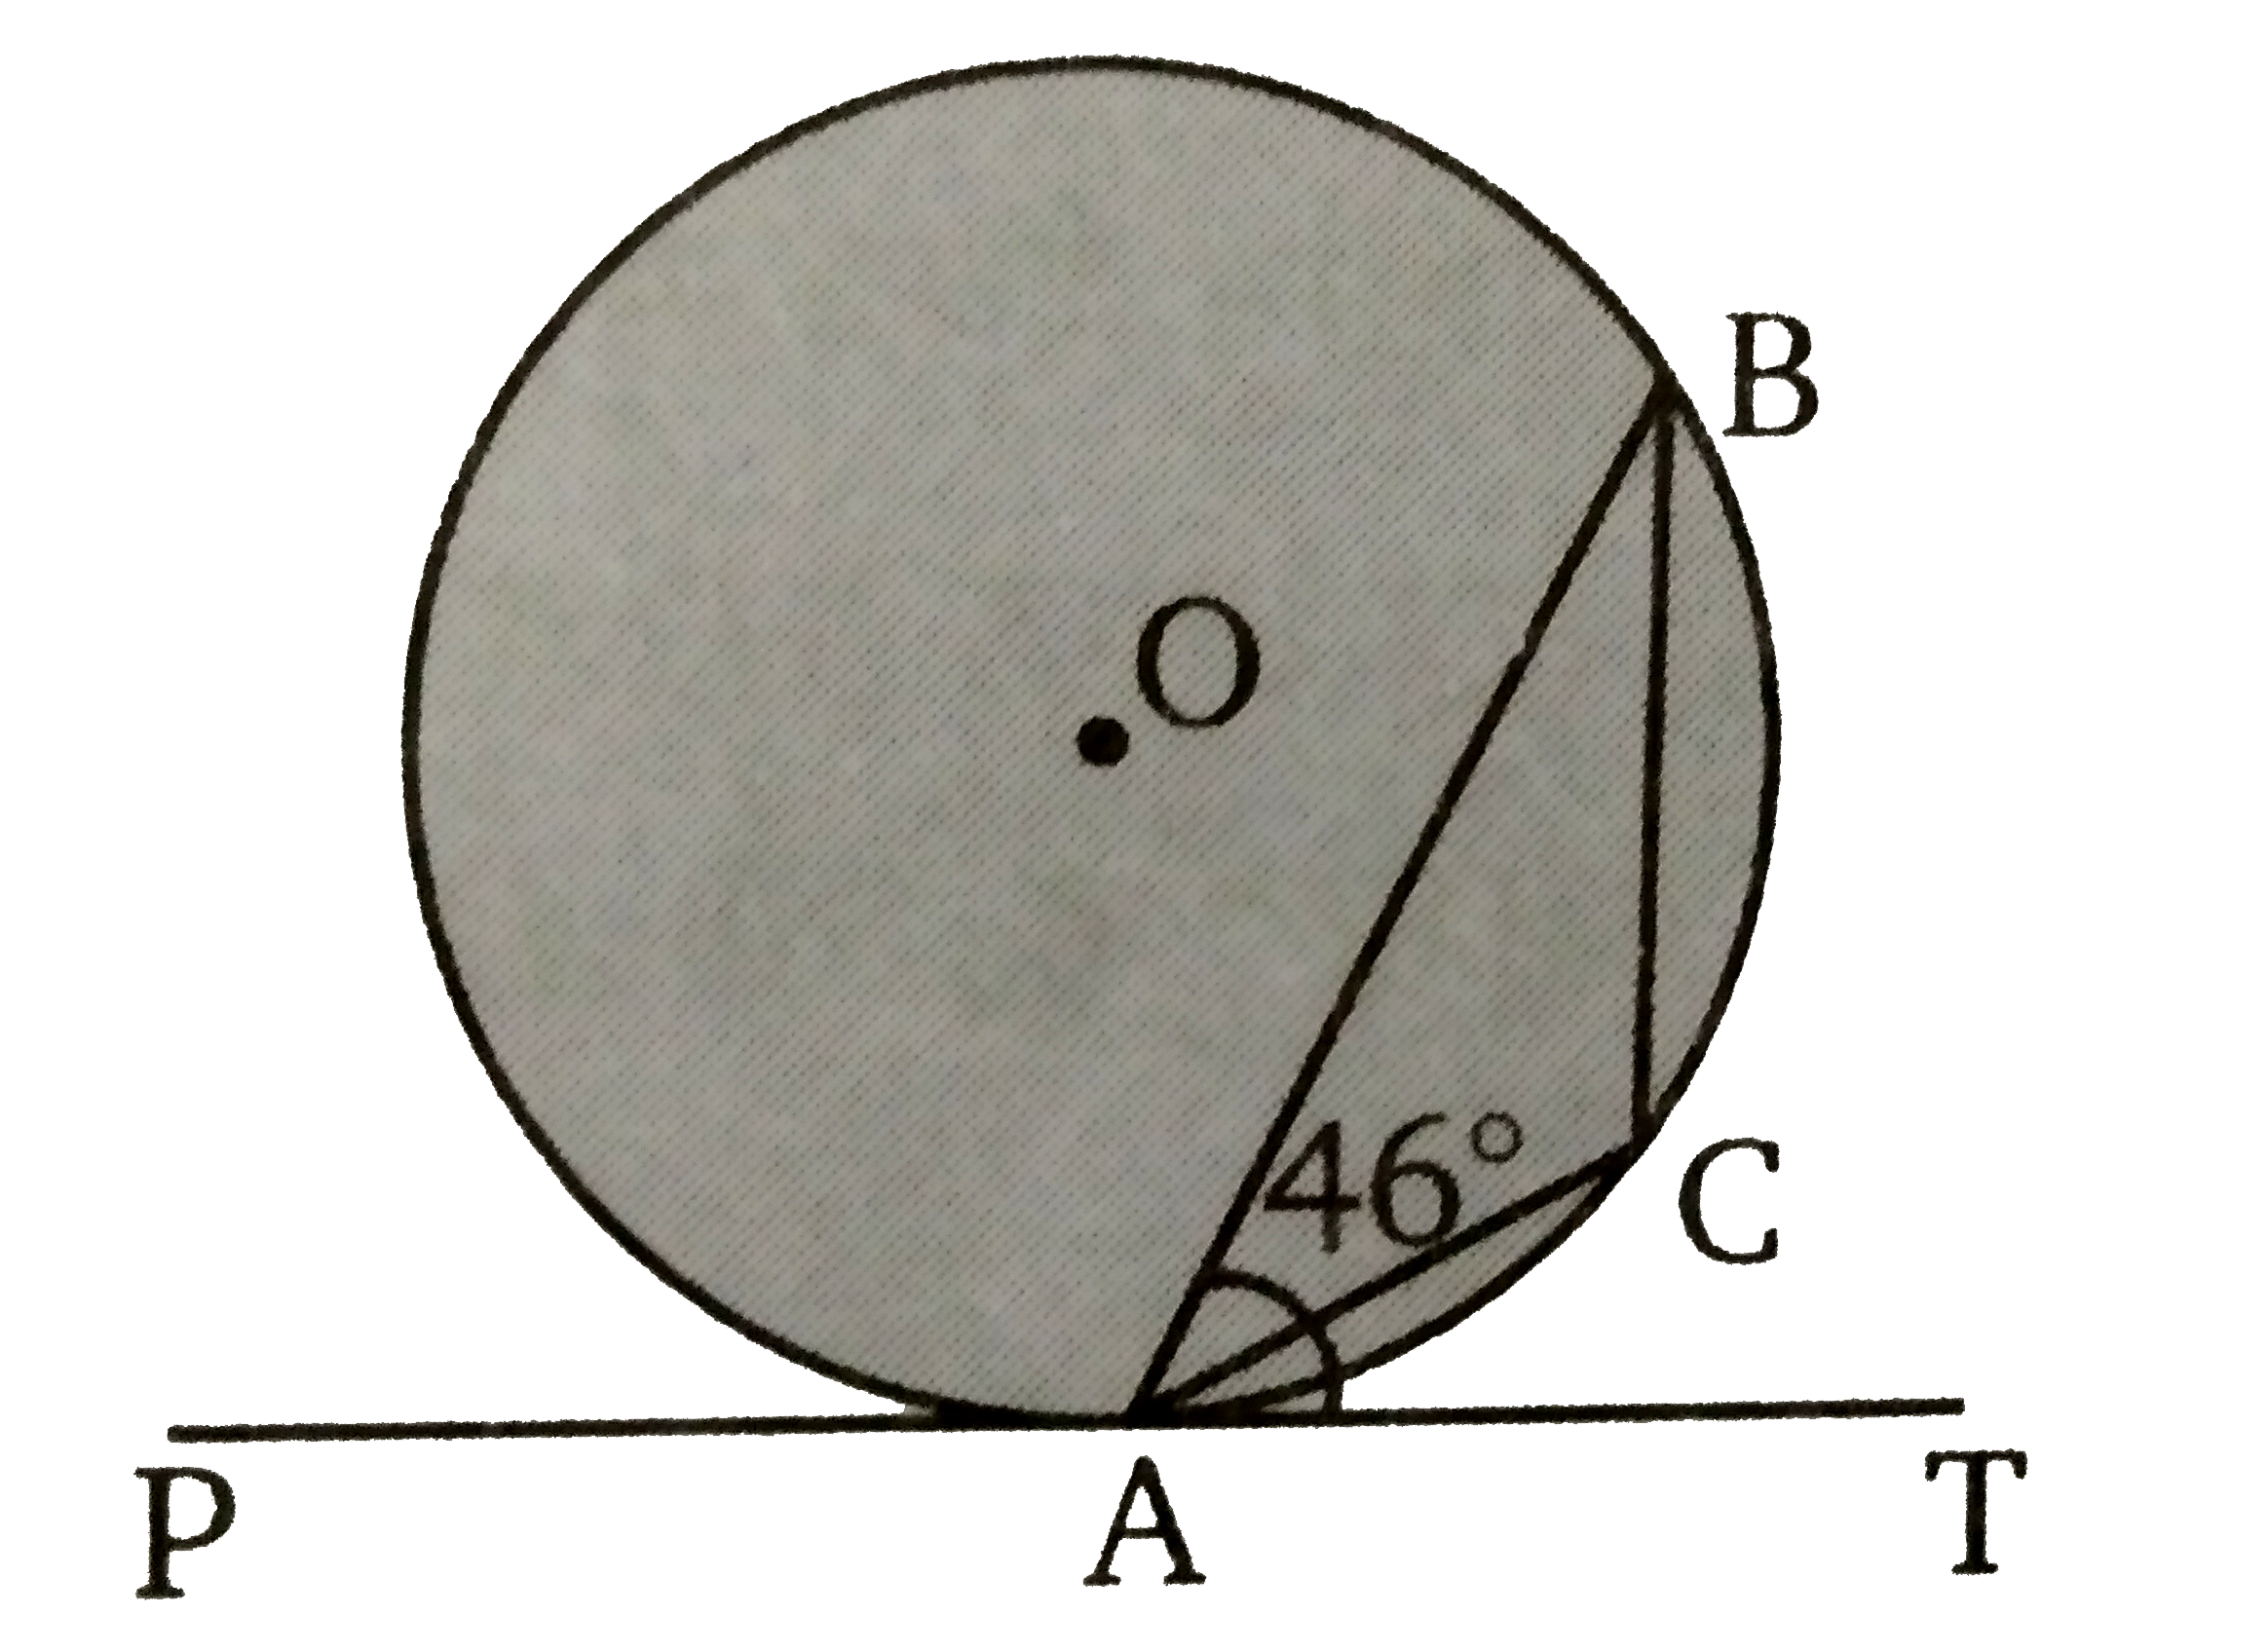
निम्न प्रत्येक चित्र में x के मान ज्ञात कीजिए ।

The correct Answer is:(i) 6 सेमी (ii) 12.67 सेमी
Step by step video & image solution for निम्न प्रत्येक चित्र में x के मान ज्ञात कीजिए । by Maths experts to help you in doubts & scoring excellent marks in Class 10 exams.
Updated on:21/07/2023टॉपर्स ने हल किए ये सवाल
- वृत्त BOOK - BALAJI PUBLICATIONCHAPTER - वृत्त EXERCISE - अभ्यास प्रश्न 8.2 (अतिलघु उत्तरीय प्रश्न)
11 Videos
- वृत्त BOOK - BALAJI PUBLICATIONCHAPTER - वृत्त EXERCISE - अभ्यास प्रश्न 8.2 (लघु उत्तरीय प्रश्न - I)
5 Videos
- वृत्त BOOK - BALAJI PUBLICATIONCHAPTER - वृत्त EXERCISE - अभ्यास प्रश्न 8.1 (लघु उत्तरीय प्रश्न - II)
2 Videos
- वास्तविक संख्याऐंBOOK - BALAJI PUBLICATIONCHAPTER - वास्तविक संख्याऐंEXERCISE - स्वमूल्यांकन परीक्षण
18 Videos
- वृत्तों से समबन्धित क्षेत्रफल BOOK - BALAJI PUBLICATIONCHAPTER - वृत्तों से समबन्धित क्षेत्रफल EXERCISE - स्वमूल्यांकन परीक्षण
15 Videos
समान प्रश्न
दिये गए चित्र में O केन्द्र वाले एक वृत्त के बिन्दु A पर PAQ एक स्पर्शी है तथा ∠BAQ=60∘ तब ∠ABC का मान ज्ञात कीजिए ।

View Solutionदिये गये चित्र में रेखा PAT वृत्त को बिन्दु A पर स्पर्श करती है। बिन्दु A से एक जीवा AB इस प्रकार खींची जाती है रेखा PAT से 46∘ का कोण बनाती है। ∠ACB, रेखाखण्ड ACB में कोण है। ∠ACB की माप ज्ञात कीजिए ।

View Solutionएक बिंदु A वृत्त केन्द्र से 26 सेमी दूर है तथा A से वृत्त पर स्पर्शी की लम्बाई 24 सेमी है। वृत्त की त्रिज्या ज्ञात कीजिए ।
View Solutionनिम्नलिखित संख्या-युग्मो के HCF ज्ञात कीजिए ।
(i) 156, 13
(ii) 1001, 385
(iii) 81445, 687897
View Solution6 सेमी त्रिज्या वाले वृत्त पर 60∘ पर त्रिज्यखण्ड का क्षेत्रफल व परिमाप ज्ञात कीजिए ।
View SolutionIdentify the cell organelle 'A' :-
ltimg src="https://d10lpgp6xz60nq.cloudfront.net/physics_images/ALN_BIO_C10_E08_018_Q01.png" width="80%"gt
View SolutionHow many lines of symmetry does the above figure have ?
View SolutionWhich of the following are correct chain isomers of butane ? (i)
View SolutionDetermine the point of symmetry of a regular hexagon.
View SolutionDtermine the images of the following figure about the given line :
View SolutionMatch the following Column A to Column B

View SolutionMatch the following Column A to Column B

View SolutionMatch the following Column A to Column B

View SolutionThe inequation represented by the graph given below is :
View SolutionThe inequation that best describes the graph given below is _________
View SolutionThe inequation that best describes the following graph is _________
View Solution
