Explain the following temperature vs time graph.

i. The given temperature v/s time graph demonstrates the behaviour of water when heated continuously and uniformly.
ii. a. Line segment AB indicates temperature of ice remaining constant at 0∘C for certain period of time (about 4 minutes).
b. This means, amount of heat (latent heat of fusion) supplied to ice is entirely used for changing its state from solid to liquid.
c. Thus, line segment AB denotes conversion office at 0∘C into water at0∘C.
iii. Line segment BC indicates continuous rise m temperature of water from 0∘C to 100∘C .
iv. a. At point C, boiling point of water is reached and heat energy (latent heat of vaporisation) supplied further is used to convert water into steam.
b. During this transformation, temperature remains unchanged as represented by line segment CD.
c. Thus, line segment CD denotes conversion of water at 100∘C into steam at 100∘C.
Similar Questions
Pressure vs volume graph at constant temperature is known as…………….
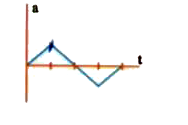
View SolutionWhich of the following v Vs t graph are correct representation for the acceleration Vs time graph shown below

View SolutionA ball is thrown vertically upward. For the motion of the ball till it returns to ground, draw the (i)height vs time graph (ii) velocity vs time graph (iii) acceleration vs time graph (iv) velocity vs height graph
View SolutionExplain Graph of time against temperature for Hope's Apparatus
View SolutionGraphs in Kinematics|| Displacement-time graph|| Velocity-time graph|| accn vs time graph
View SolutionState and explain Boyle's law. Draw PV vs P Graph at constant temperature.
View SolutionPressure vs volume graph is shown in the figure . Find corresponding pressure vs temperature graph :
View SolutionInstantaneous Velocity#!#Position vs time graph
View Solution

