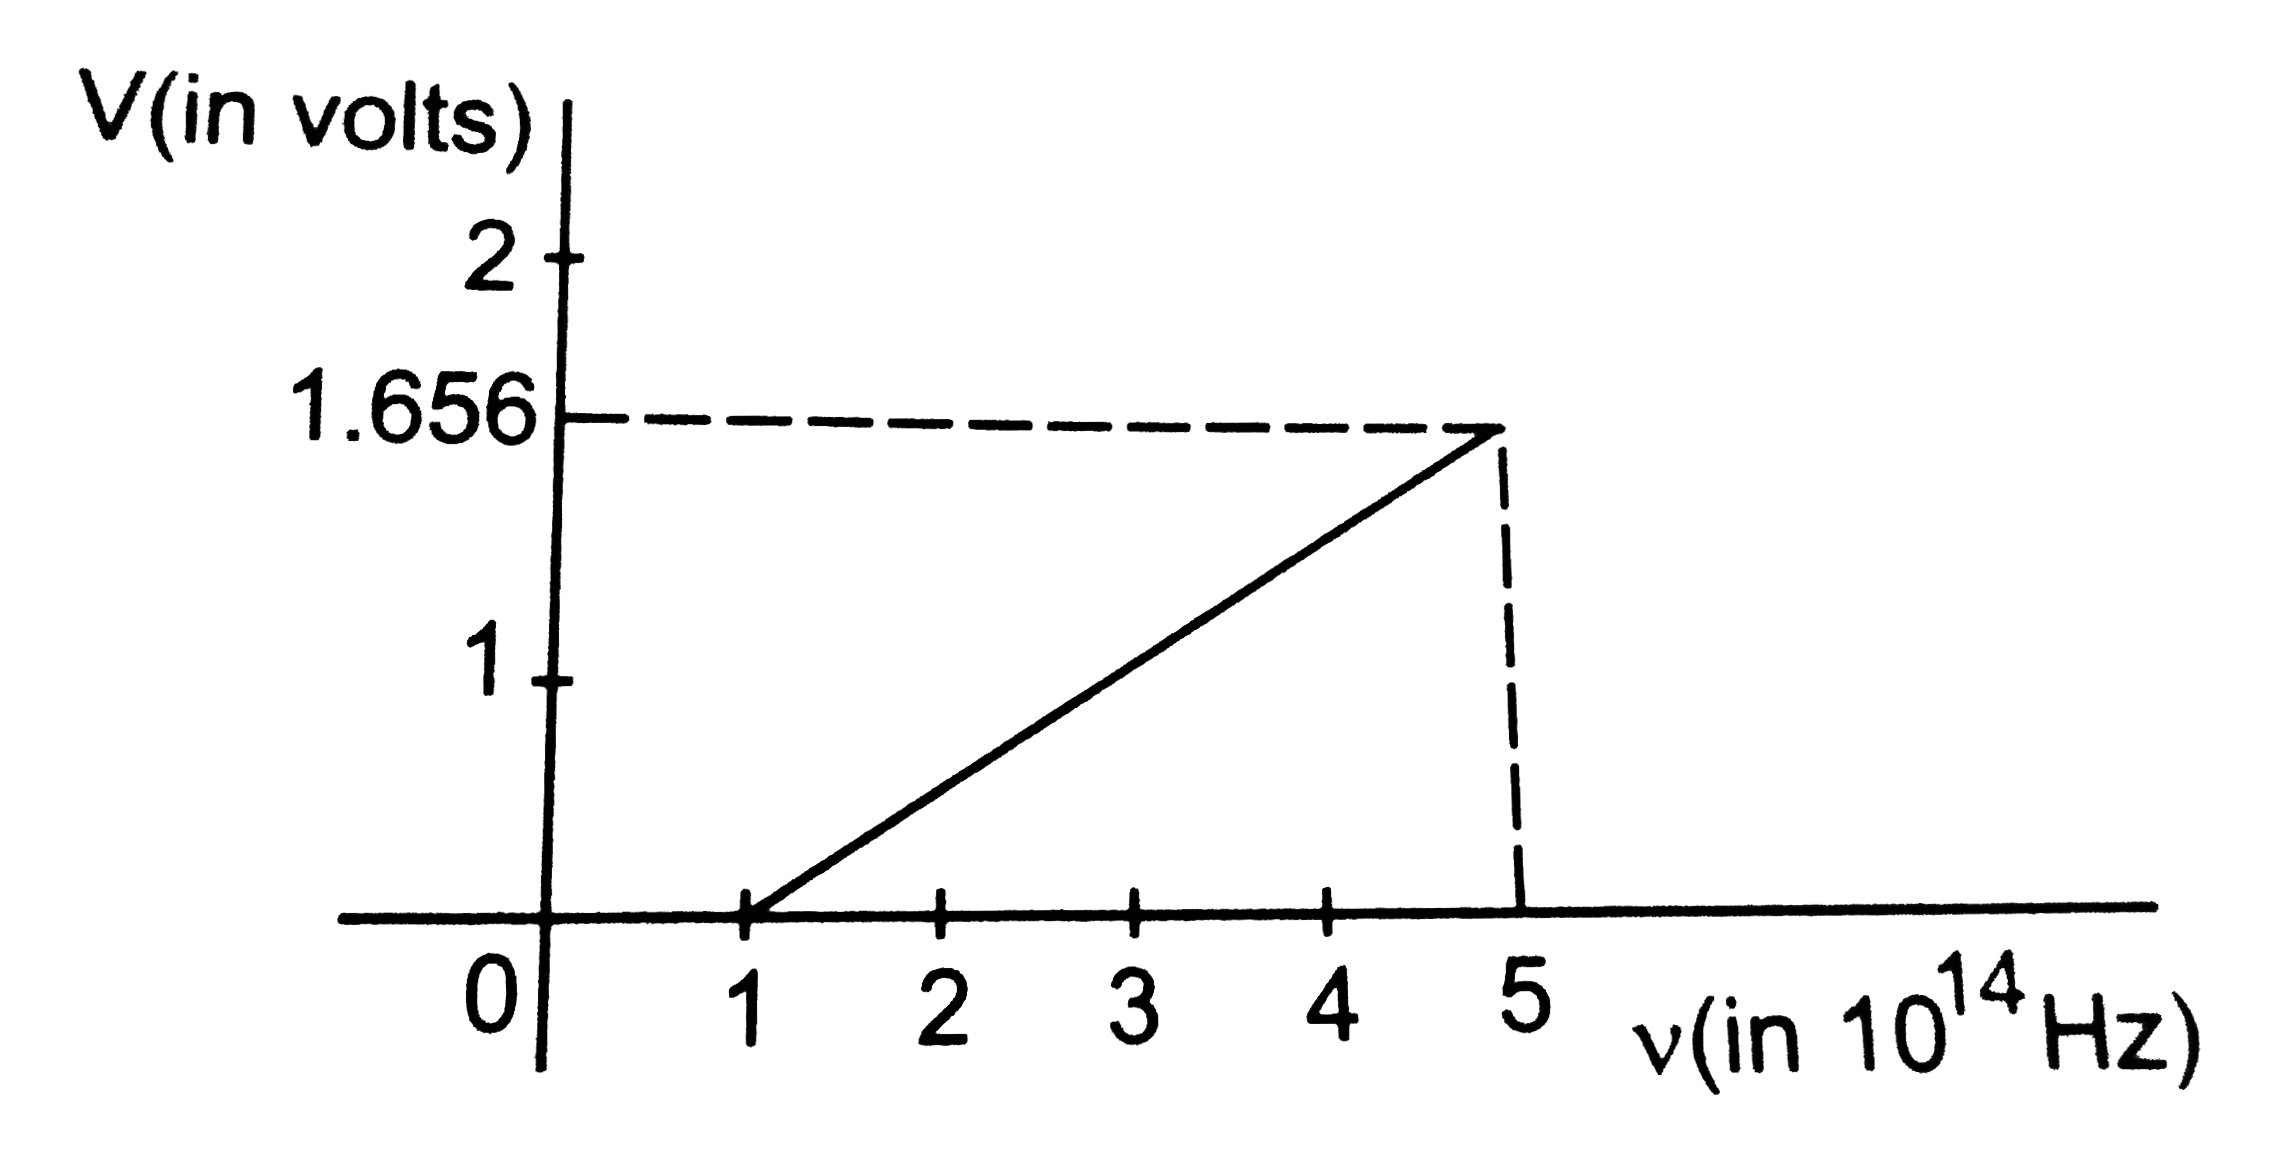
Figure shows graph of stopping potential v frequency in experiment of photo-electric effect work function of metal will be……e=change of electron.
 Solution in Gujrati
Ov×e(∈eV)
OB (In volt)
OA (in eV)
Slope of line AB
The correct Answer is:A
From Einstiein.s equation,
V0=(he)v−ϕ0e
Comparing with y=mx+c
Intercept of V0 axis =−ϕ0e
∴OB=ϕ0e⇒ϕ0Ob×e (in electron volt)
Neglecting negative sign.
Similar Questions
For photo senstive surface A and B graph of stopping potential versus frequency (v) is shown in figure .From graph work function of A surface …..
View SolutionFigure is the plot of the stopping potential versus the frequency of the light used in an experiment on photoelectric effect. Find (a) the ratio h/e and (b) the work function.

View SolutionPhoto electric effect:-Introduction||Effect OF intensity||Voltage and frequency on photo-electric effect||Graphs OF photo current||Work-function:-metal
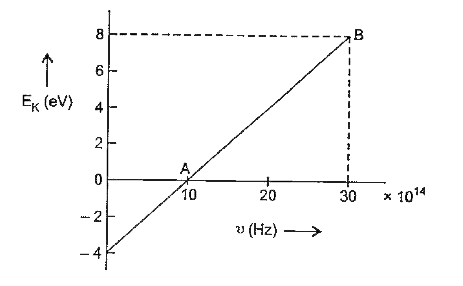
View SolutionIn an experiment of photo-electric effect, the graph of maximum kinetic energy Ek of the emitted photoelectrons versus the frequency v of the incident light is a straight line AB as shown in figure below :

Work function of the metal.
View SolutionIn photo-electric effect, what is meant by the terms:
(i) Work function of a metal.
(ii) Stopping potential.
View SolutionThe following figure shows a graph for the stopping potential as a function of the frequency of incident light illuminating a metal surface. Find the photoelectric work function for this surface.
View SolutionThe stopping potential as a function of frequency of incident radiation is plotted for two different photo electric surfaces A and B, The graphs show the work function of A is
View SolutionFor photo electric effect in metal, the graph of stopooing potential V _(0) versus frequency v (Hz) of he incident radiation is shown. From the graph find work function in metal
View Solution

