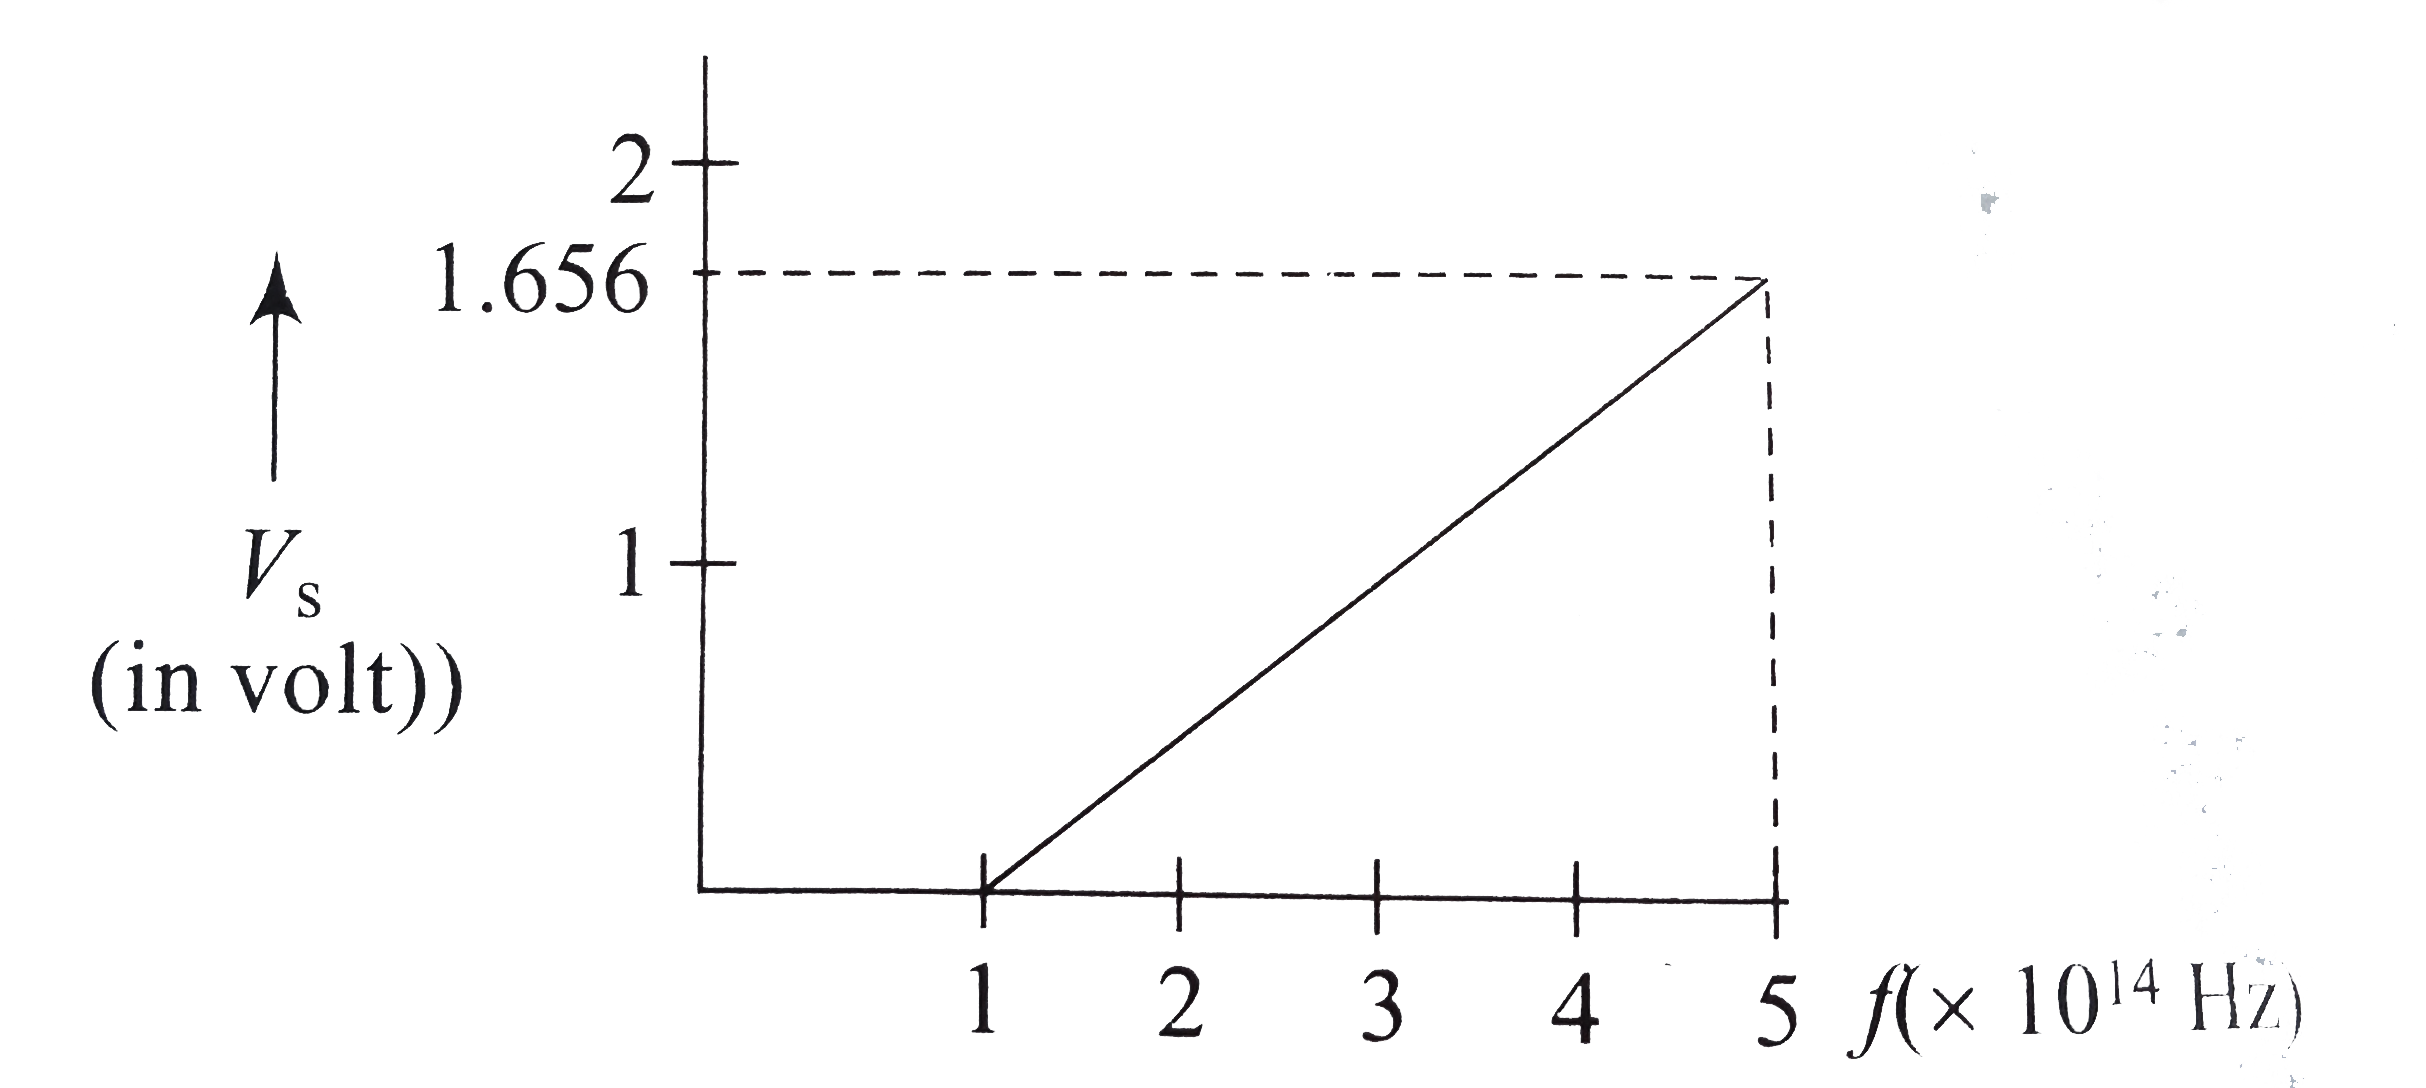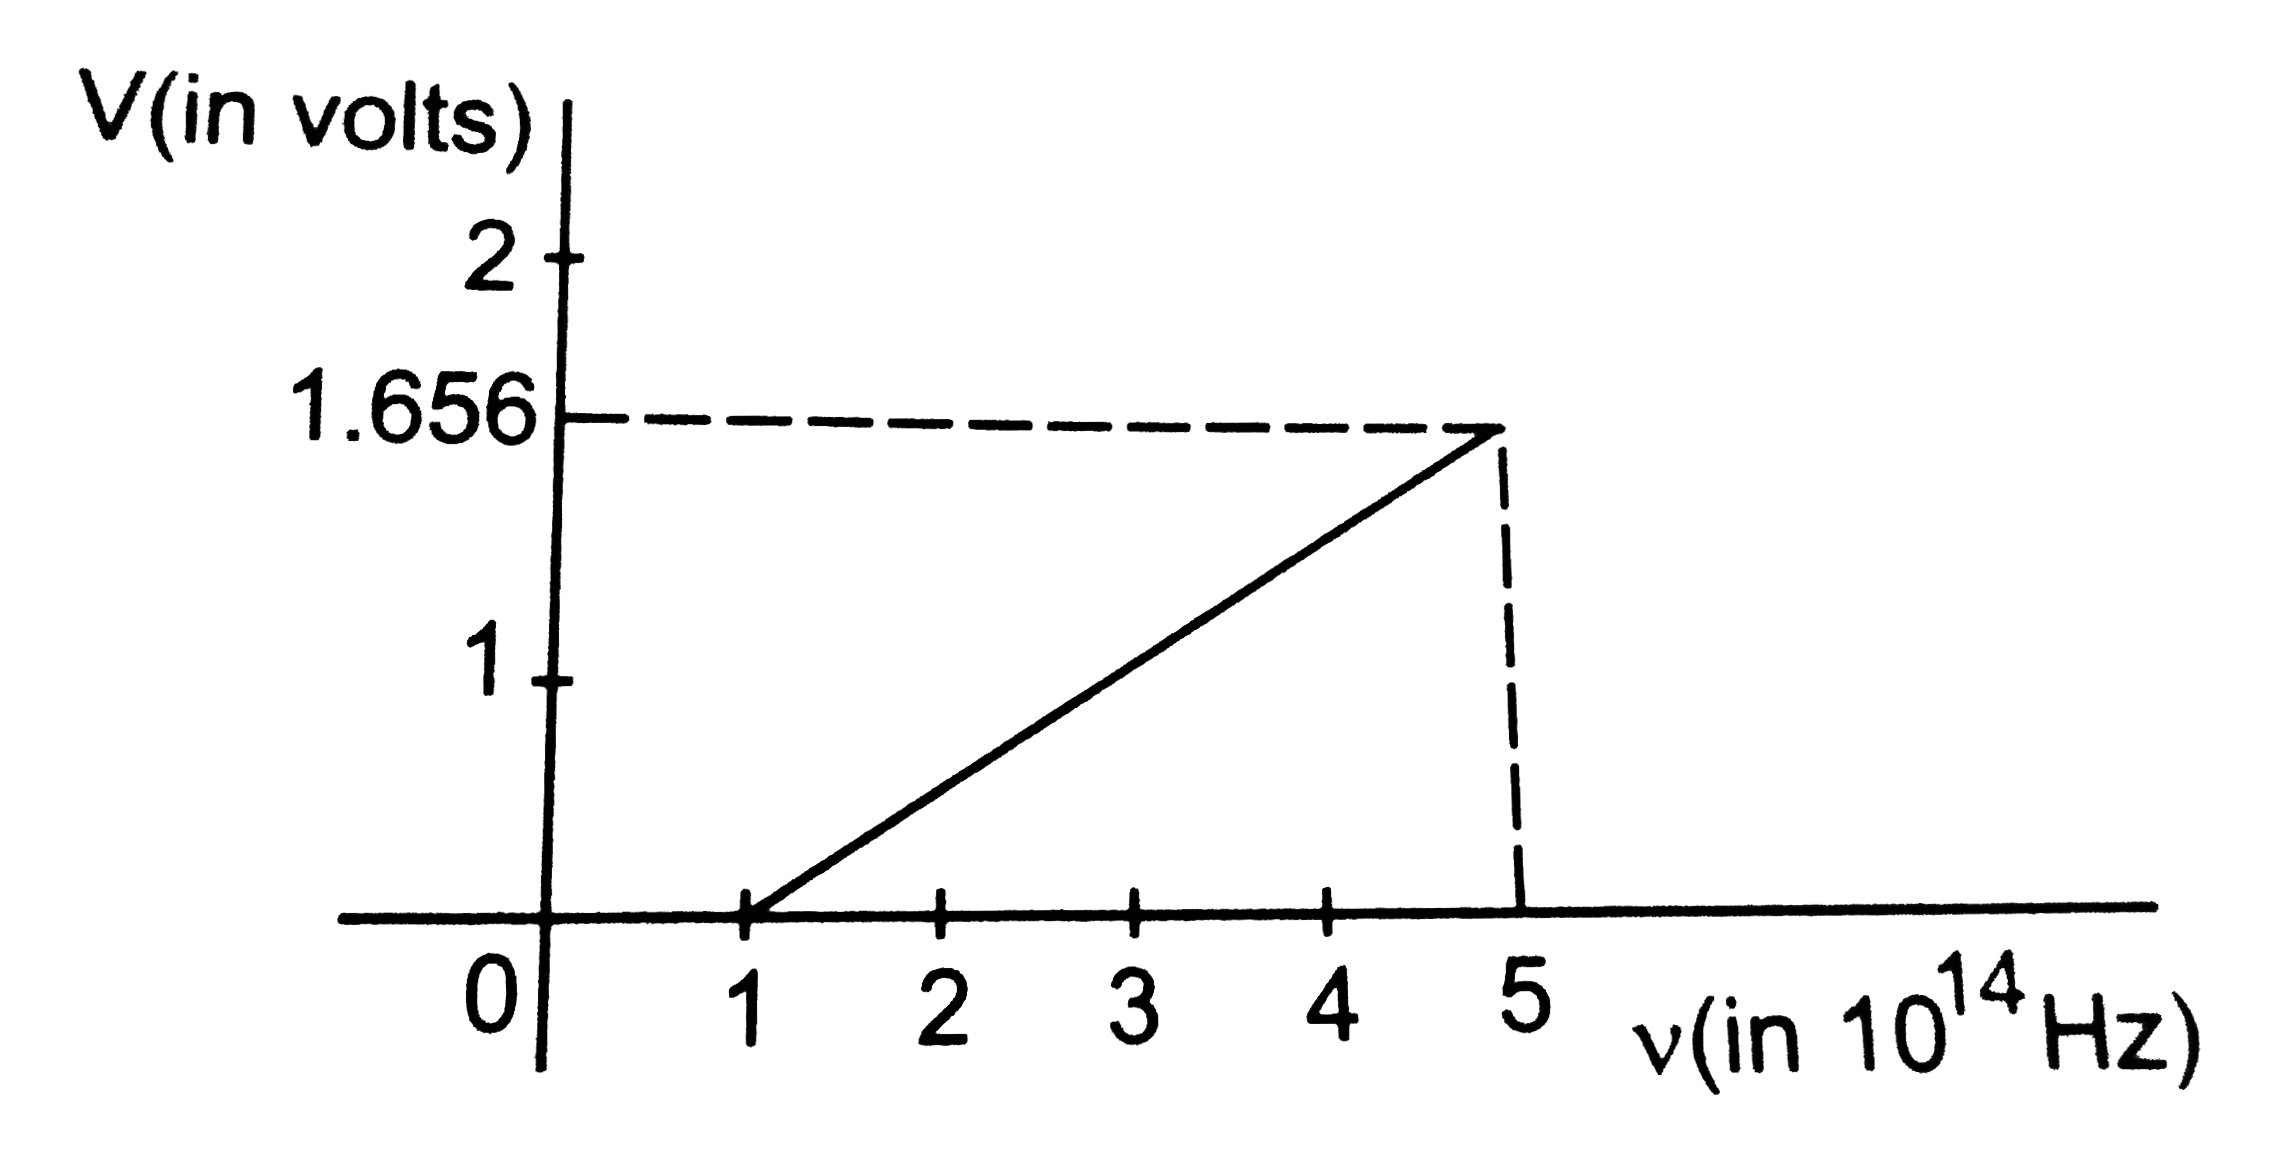
Figure shows the plot of the stopping potential versus the frequency of the light used in an experiment on photoelectric effect. The ratio he is
A
10−15Vs−15Vs
B
2×10⁻¹⁵Vs
C
3×10⁻¹⁵Vs
D
4.14×10⁻¹⁵Vs
Video Solution
Text Solution
The correct Answer is:D
eVS=hc−ϕ0
VS=hev−ϕ0e
Now, he=slope=1.6564×1014
=0.414×10⁻¹⁴Vs
4.14×10⁻¹⁵Vs
|
Similar Questions
Knowledge Check
A non-monochromatic light is used in an experiment on photoelectric effect. The stopping potential
Ais related to the mean wavelengthBis related to the longest wavelengthCis related to the shortest wavelengthDis not related to the wavelengthWhen stopping potential is applied in an experiment on photoelectric effect, no photo current is observed. This means that
AThe emission of photoelectrons is stoppedBThe photoelectrons are emitted but are reabsorbed by the emitter metalCThe photoelectrons are accumulated near the collector plateDThe photoelectrons are dispersed from the sides of the apparatus.When stopping potential is applied in an experiment on photoelectric effect, no photo current is observed. This means that
AThe emission of photoelectrons is stoppedBThe photoelectrons are emitted but are reabsorbed by the emitter metalCThe photoelectrons are accumulated near the collector plateDThe photoelectrons are dispersed from the sides of the apparatus.
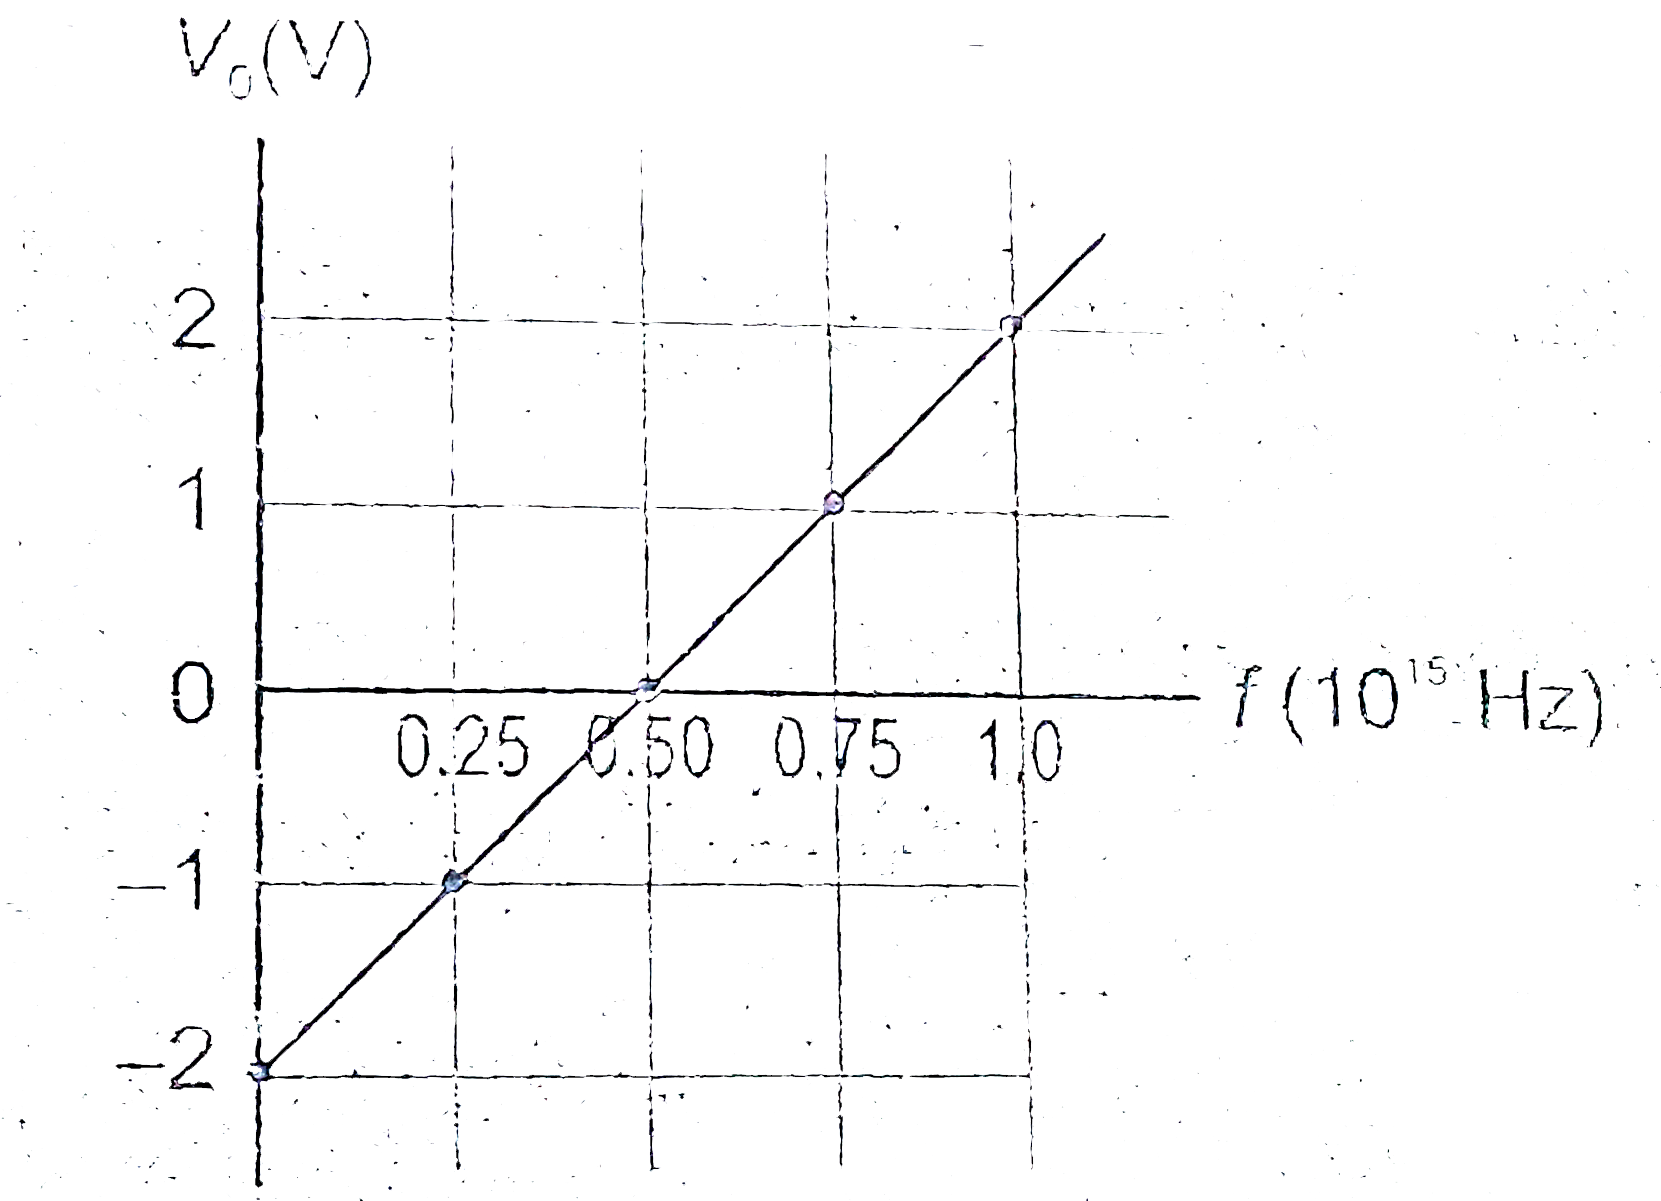
The following figure shows a graph for the stopping potential as a function of the frequency of incident light illuminating a metal surface. Find the photoelectric work function for this surface.

View SolutionDraw and explain the graph showing the variation of stopping potential with frequency of incident radiation in relation to photoelectric effect.
View SolutionThe magnitude of stopping potential for the photoelectric effect is
View SolutionIn photoelectric effect, stopping potential depends on
View SolutionIn photoelectric effect, stopping potential depends on
View Solution

