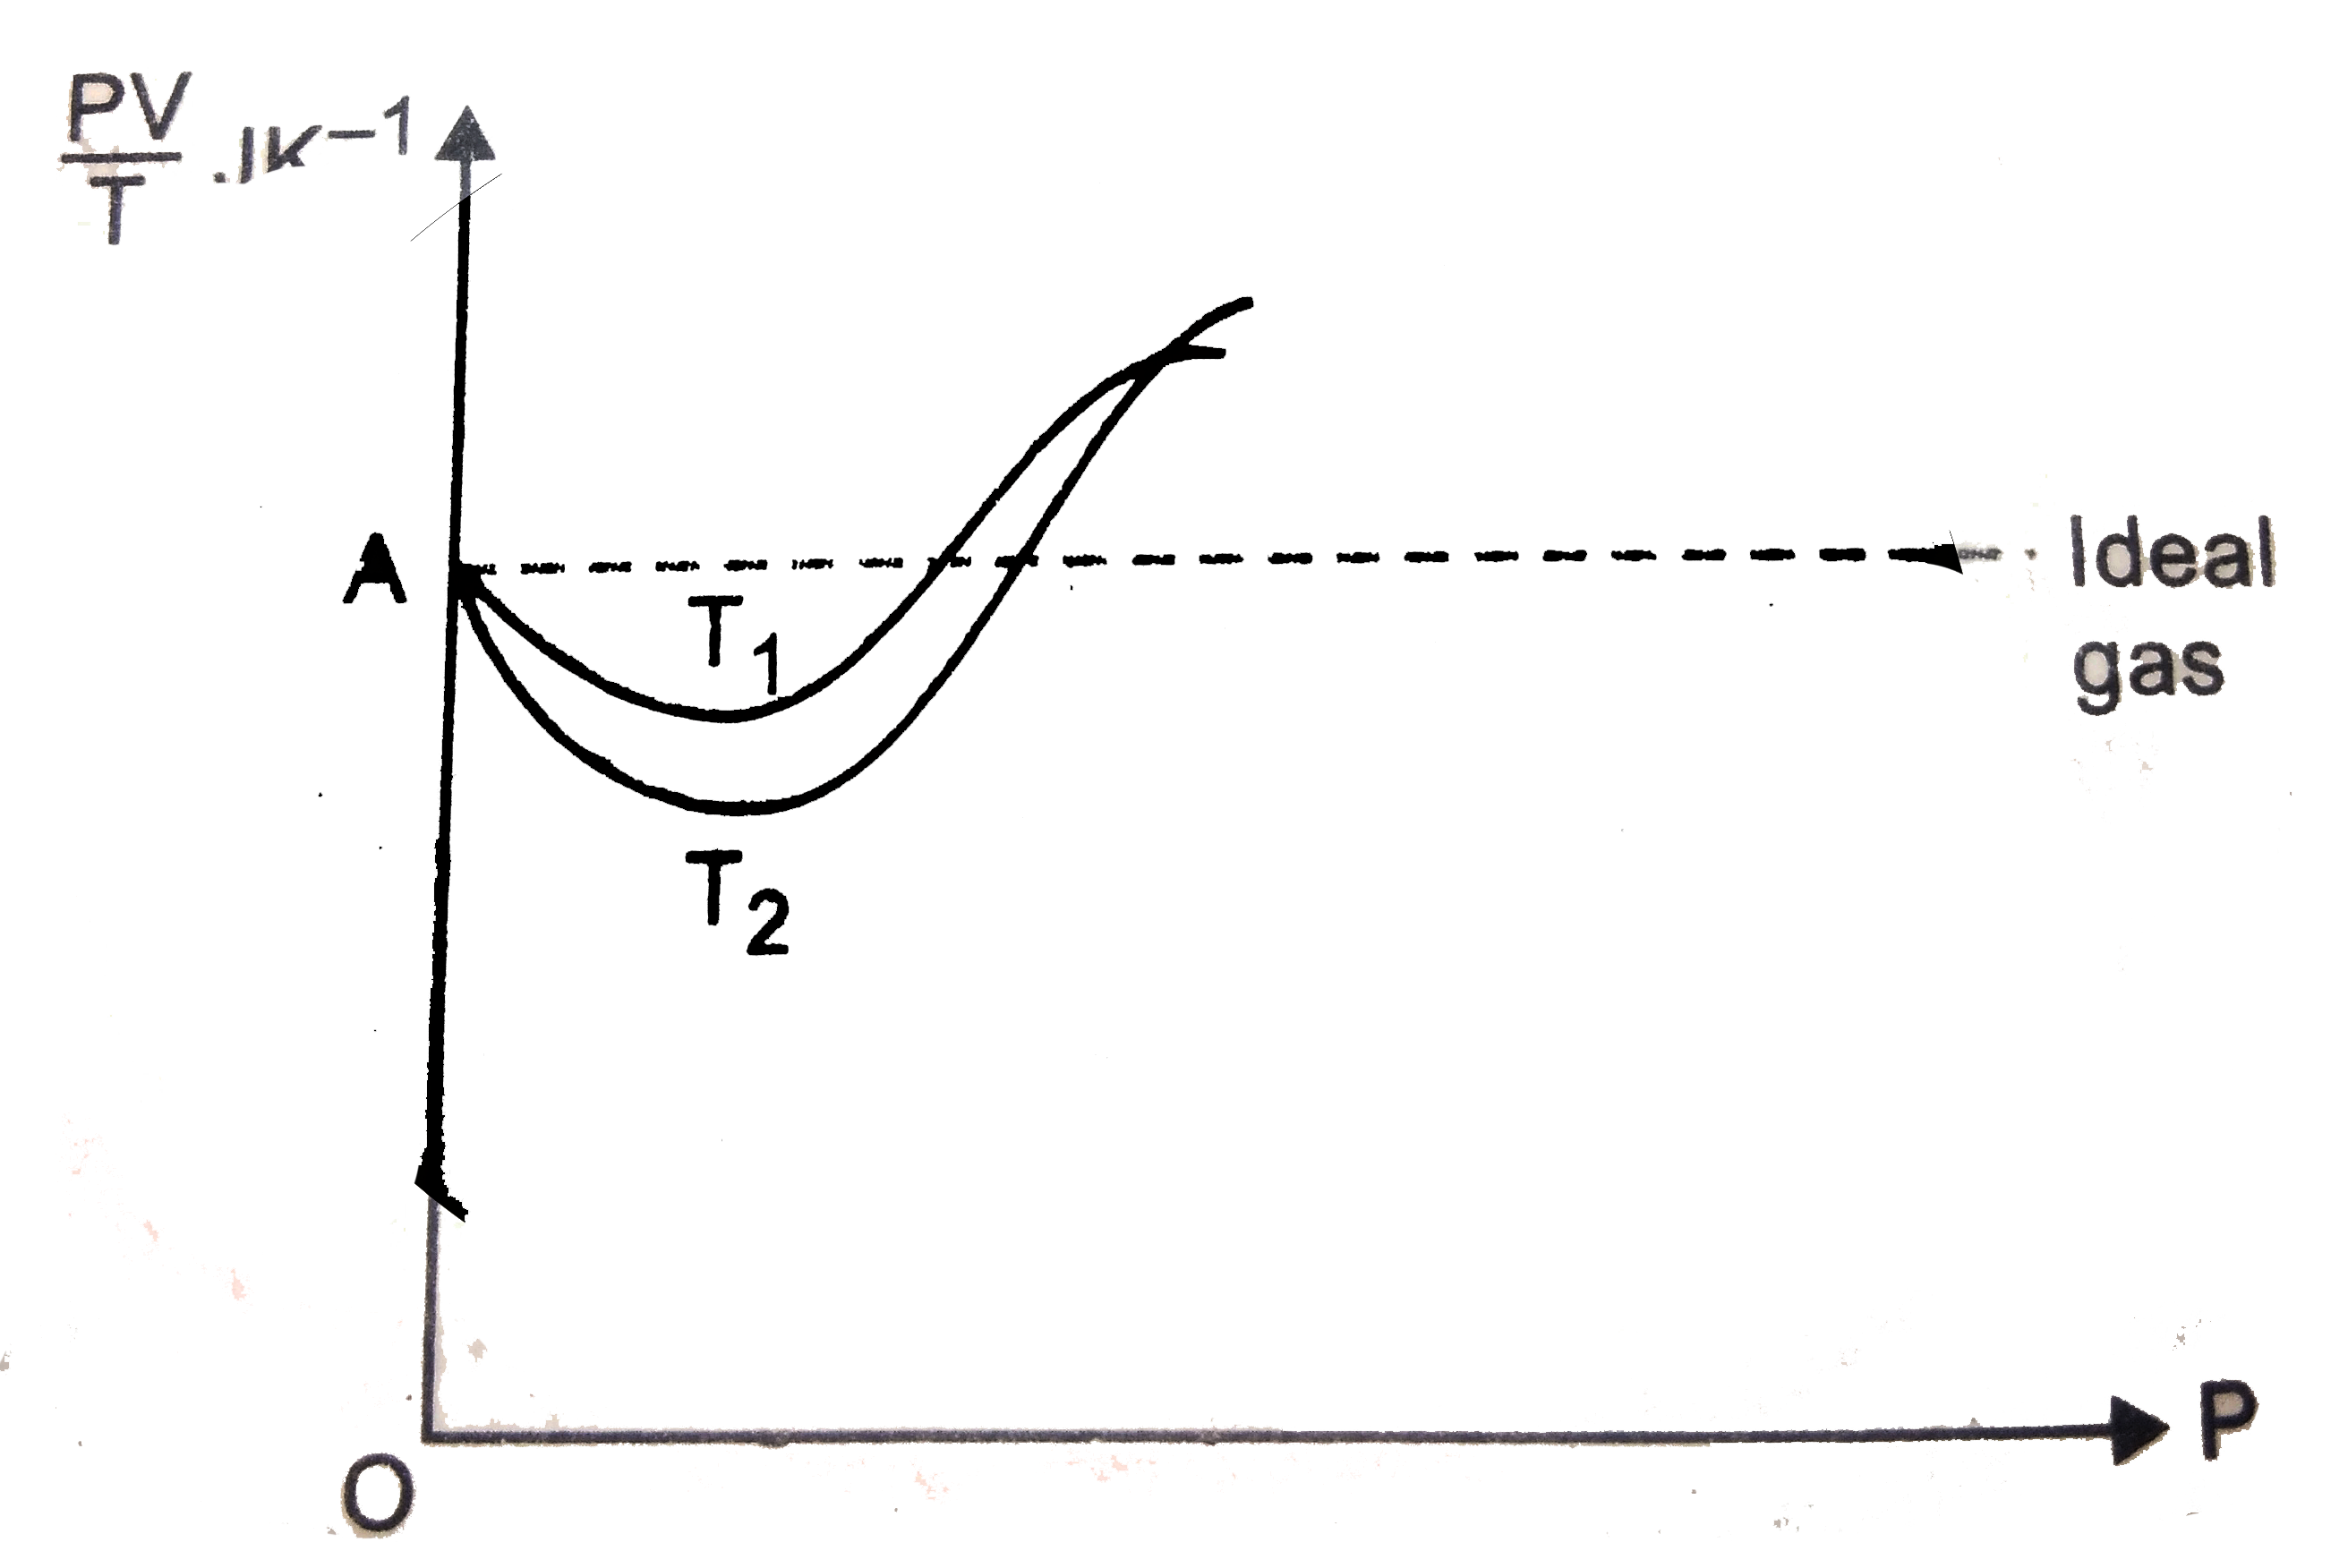
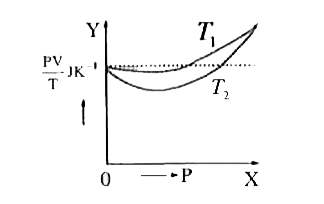
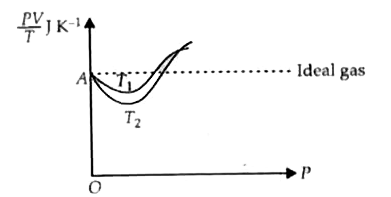
Given is the graph between PVT and P for 1 gm of oxygen gas at two different temperatures T1andT2 Fig. Given, density of oxygen =1.427kgm−3. The value of (PV)/(T) at the point A and the relation between T1andT2 are respectively :

0.259JK−1andT1<T2
8.314gJmol−1K−1andT1>T2
0.259JK−1andT1>T2
4.28gJK−1andT1<T2
The correct Answer is:C
PV=μRT=mMRT,
where m = mass of the gas
and mMμ = number of moles.
PVT=1g32gmol1×8.31Jmol−1K−1=0.259JK−1
Also, T1>T2
Similar Questions
Freundlich adsorption isotherms for the physical adsorption of a gas at temperature T_(1), T_(2) and T_(3) are shown in the graph given below. The correct relationship between T_(1), T_(2) and T_(3) is
View SolutionFigure show plot of (PV)/(T) and P for 2gm of oxygen gas at two different temeratures. (i)The significance of dotted line (ii)The relation between T_(1) and T_(2) (iii)The value of (PV)/(T) where the curves meet on the Y-axis.
View SolutionGiven is the graph between PV/T and P for 1 gm of oxygen gas at two different temperature T_(1) and T_(2) (Given:Density of oxygen= 1.429 kg//m^(3) ).The value of PV/T at the point A and the relation between T_(1) and T_(2) and respectively
View SolutionFigure shows plot of PVT and P for 2gm of oxygen gas at two different temperatures

(i) The significance of dotted line
(ii) The relation between T1andT2
(iii) The value of PVT where the curves meet on the x-axis.
View SolutionGiven is the graph between PVT and P for 1 gm of oxygen gas at two different temperatures T1andT2 Fig. Given, density of oxygen =1.427kgm−3. The value of (PV)/(T) at the point A and the relation between T1andT2 are respectively :

View Solutionकिसी समान गैस के लिए दो भिन्न रुद्धोष्म भाग P-V चित्रानुसार, T1 व T2 पर दो समतापों (Isothermals) पर प्रतिच्छेद करते हैं।
तब VaVbका अनुपात होगा-

View Solutionचित्र में दो विभिन्न तापों T1 एवं T2 पर 1 ग्राम ऑक्सीजन गैस के लिए PVT एवं P के मध्य ग्राफ दिया गया है। दिया गया है , ऑक्सीजन का घनत्व =1.427 किग्रा/मी−3 , बिंदु A पर PV/T तथा T1 एवं T2 के मध्य सम्बन्ध के मान क्रमशः है :

View SolutionFor a certain mass of gas Isothermal relations between .P. and .V. are shown by graphs at two different temperatures T_(1) and T_(2) then
View Solution
