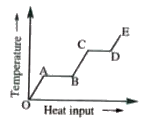
The diagram below shows the change of phases of a substance on a temperature vs time graph on heating the substance at a constant rate.
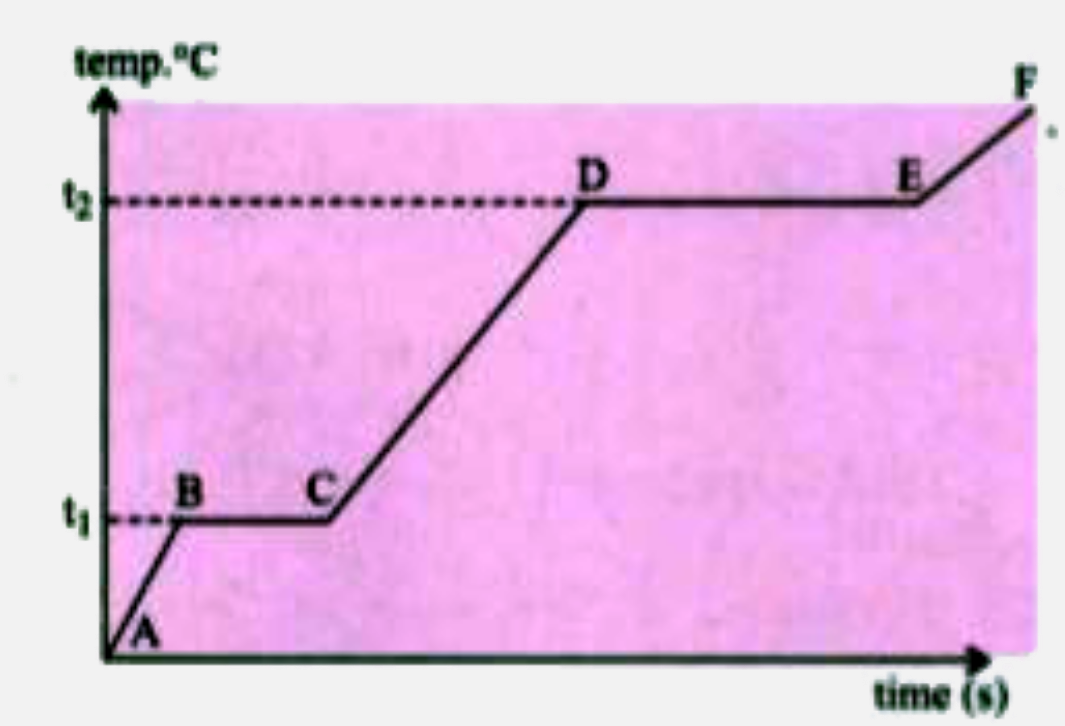
What is the boiling and melting point of the substance ?
Step by step video solution for The diagram below shows the change of phases of a substance on a temperature vs time graph on heating the substance at a constant rate. What is the boiling and melting point of the substance ? by Physics experts to help you in doubts & scoring excellent marks in Class 10 exams.
Updated on:21/07/2023Topper's Solved these Questions
Similar Questions
The figure below shows a simple pendulum of mass 200 g. It is displaced from the mean position A to the extreme position B. The potential energy at the position A is zero. At the position B the pendulum bob is raised by 5 m.
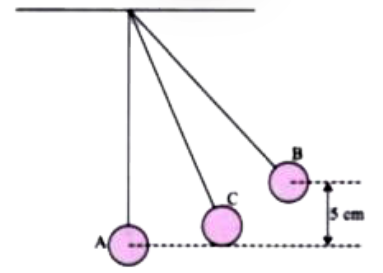
(i) What is the potential energy of the pendulum at the position B?
(ii) What is the total mechanical energy at point C?
(iii) What is the speed of the bob at the position A when released from B ?
(Take g = 10ms−2 and there is no loss of energy.)
View SolutionChoose the correct statement with respect to critical angle
View SolutionShow that the sum of kinetic energy and potential energy (ie, total mechanical energy) is always conserved in the case of a freely falling body under gravity (with air resistance neglected from a height by finding it when (i) the body is at the top c) the body has fallen a distance in the body has reached the ground.
View SolutionIf specific heat capacity of a substance in solid and liquid is proportional to the temperature of substance, then temperature Vs time plot for the substance is best present by [Assume heat is supplied to substance at constant rate and initial temperature is less than melthing pint of substance.
View SolutionWhich of the substances A, B or C has the highest specific heat ? The temperature vs time graph is shown

View SolutionA solid substance is at 30^(@)C . To this substance heat energy is supplied at a constant rate. Then temperature versus time graph is as shown in the figure. The substance is in liquid state for the portion (of the graph)
View SolutionWhich of the following graphs is the correct phase diagram of a substance whose melting point increases with pressure ?
View SolutionWhat is the normal melting point of the substance represented by the phase diagram ?
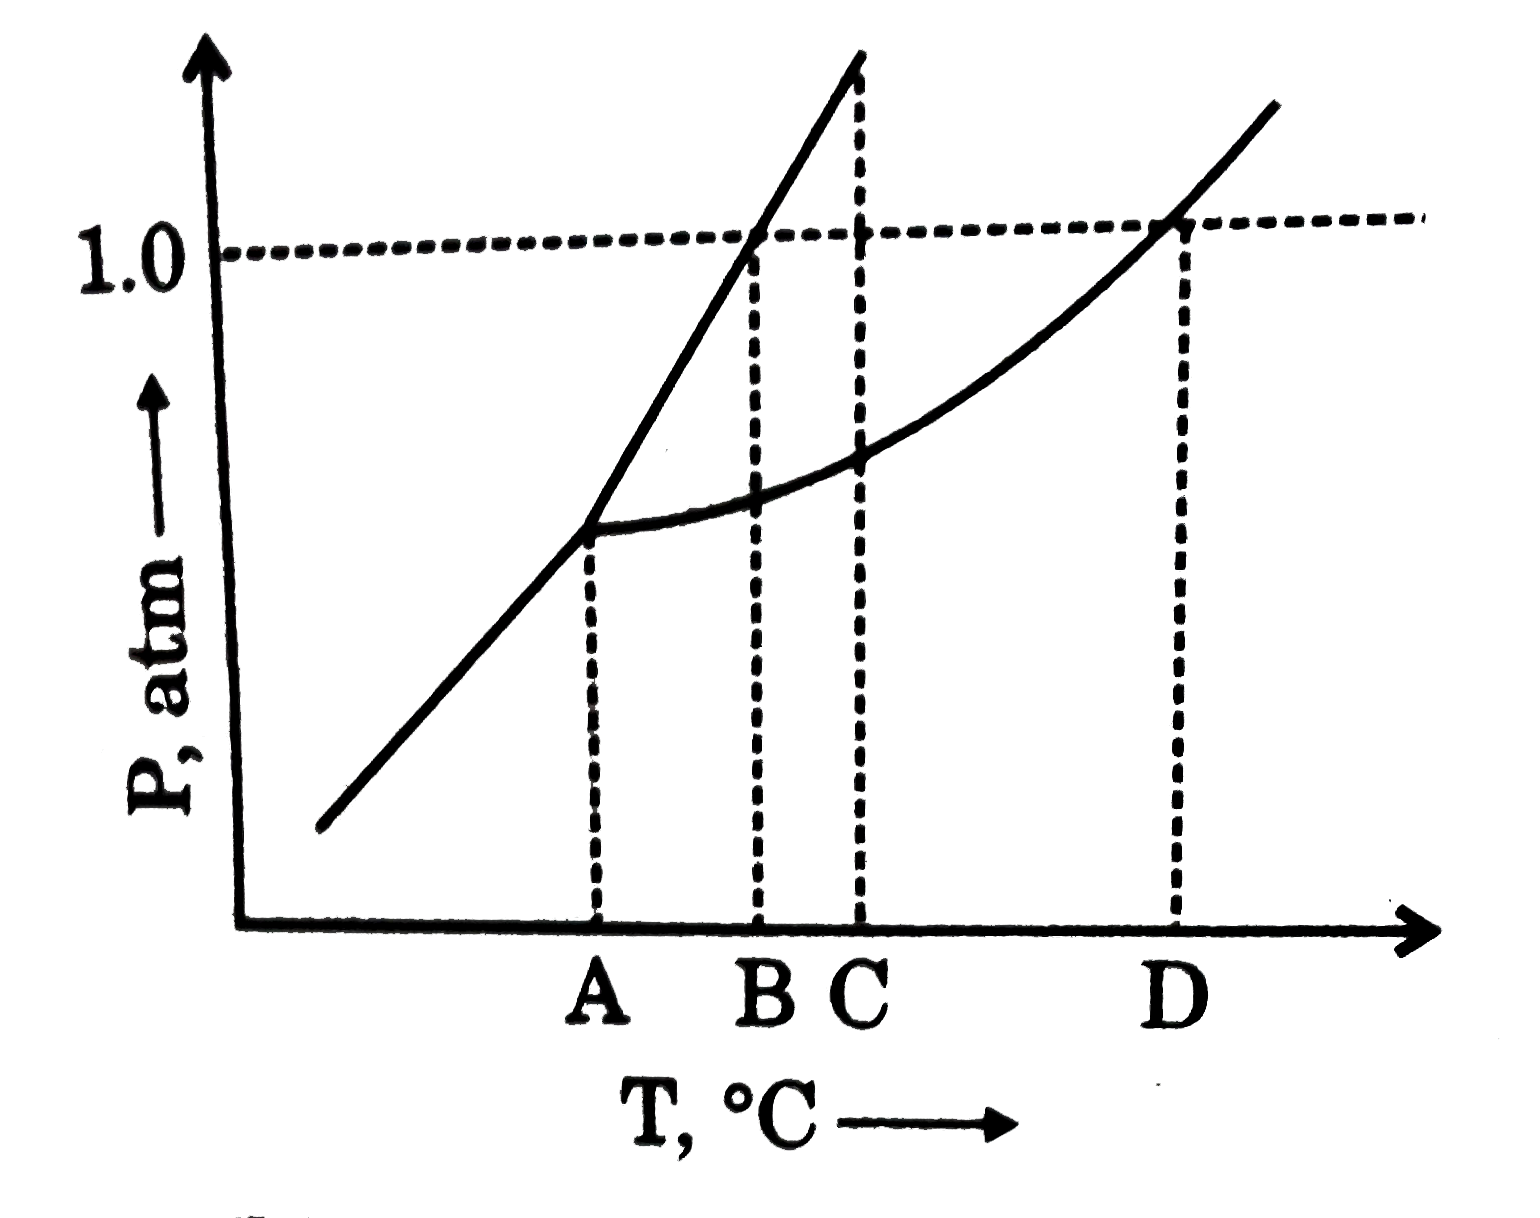
View SolutionThe graph alogside shows the heating curve for a pure substance. The temperature rises with time as the substance is heated :
What is the physical state of the substance at the point A,B,C and D?
What is the melting point of the substance ?
What is its boiling point ?
What happens to the temperature while the substance is chaging state ?
The substace is not wter. how can you judge from the graph ?
View SolutionThe temperature-time graph below shows the heating curve for pure wax. From the graph answer the following :
(a) What is the physical state of the substance at the points A, B, C and D ?
(b) What is the melting point of the substance ?
(c ) What is its boiling point ?
(d) Which portions of the graph indicates that change of state is taking place.
(e ) Name the terms used for heat absorbed during change of states involved in above processes.
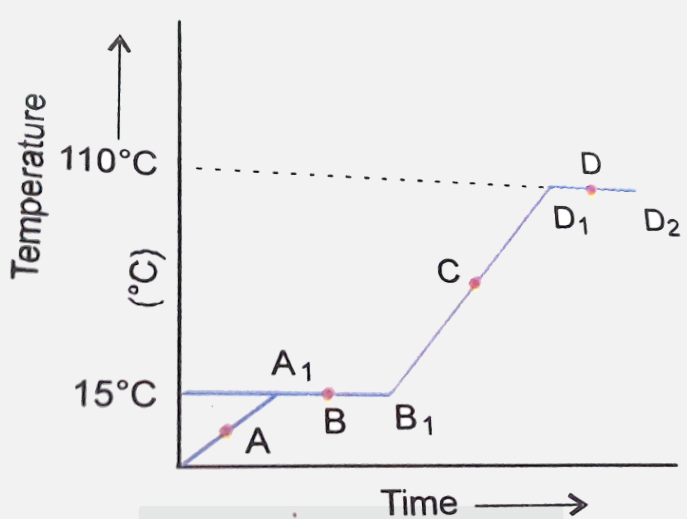
View SolutionThe given graph shows the heating curve for a pure substance. The temperature rises with time as the substance is heated : (a) What is the physical state of the substance at the points A, B, C and D ? What is the melting point of the substance ? (c ) What is its boiling point ? (d) What happens to the temperature while the substance is changing state ? (e ) The substance is not water. How can you judge from the graph ?
View SolutionA graph is drawn by taking the rise in temperature on Y axis and heat supplied on x axis .Find out the melting point and boiling point of heat substance
View Solutionगलनांक अथवा क्वथनांक पर किसी पदार्थ की विशिष्ट ऊष्माधारिता कितनी होती है ?
View Solutionनियत दर पर किसी पदार्थ को दी गई ऊष्मा तथा उससे उसके ताप में होने वाले परिवर्तन को चित्र में दर्शाया गया है | बिन्दु O पर यह पदार्थ ठोस अवस्था में है | बिन्दु P पर पदार्थ की स्थिति ______ है |
View SolutionA source of heat supplies heat at a constant rate to a substance. Fig. shows the variation of temperature of the substance with the heat supplied. The slope of segment DE represents:
View Solutionगलनांक तथा क्वथनांक पर किसी पदार्थ का ताप स्थिर क्यों रहता है?
View Solution