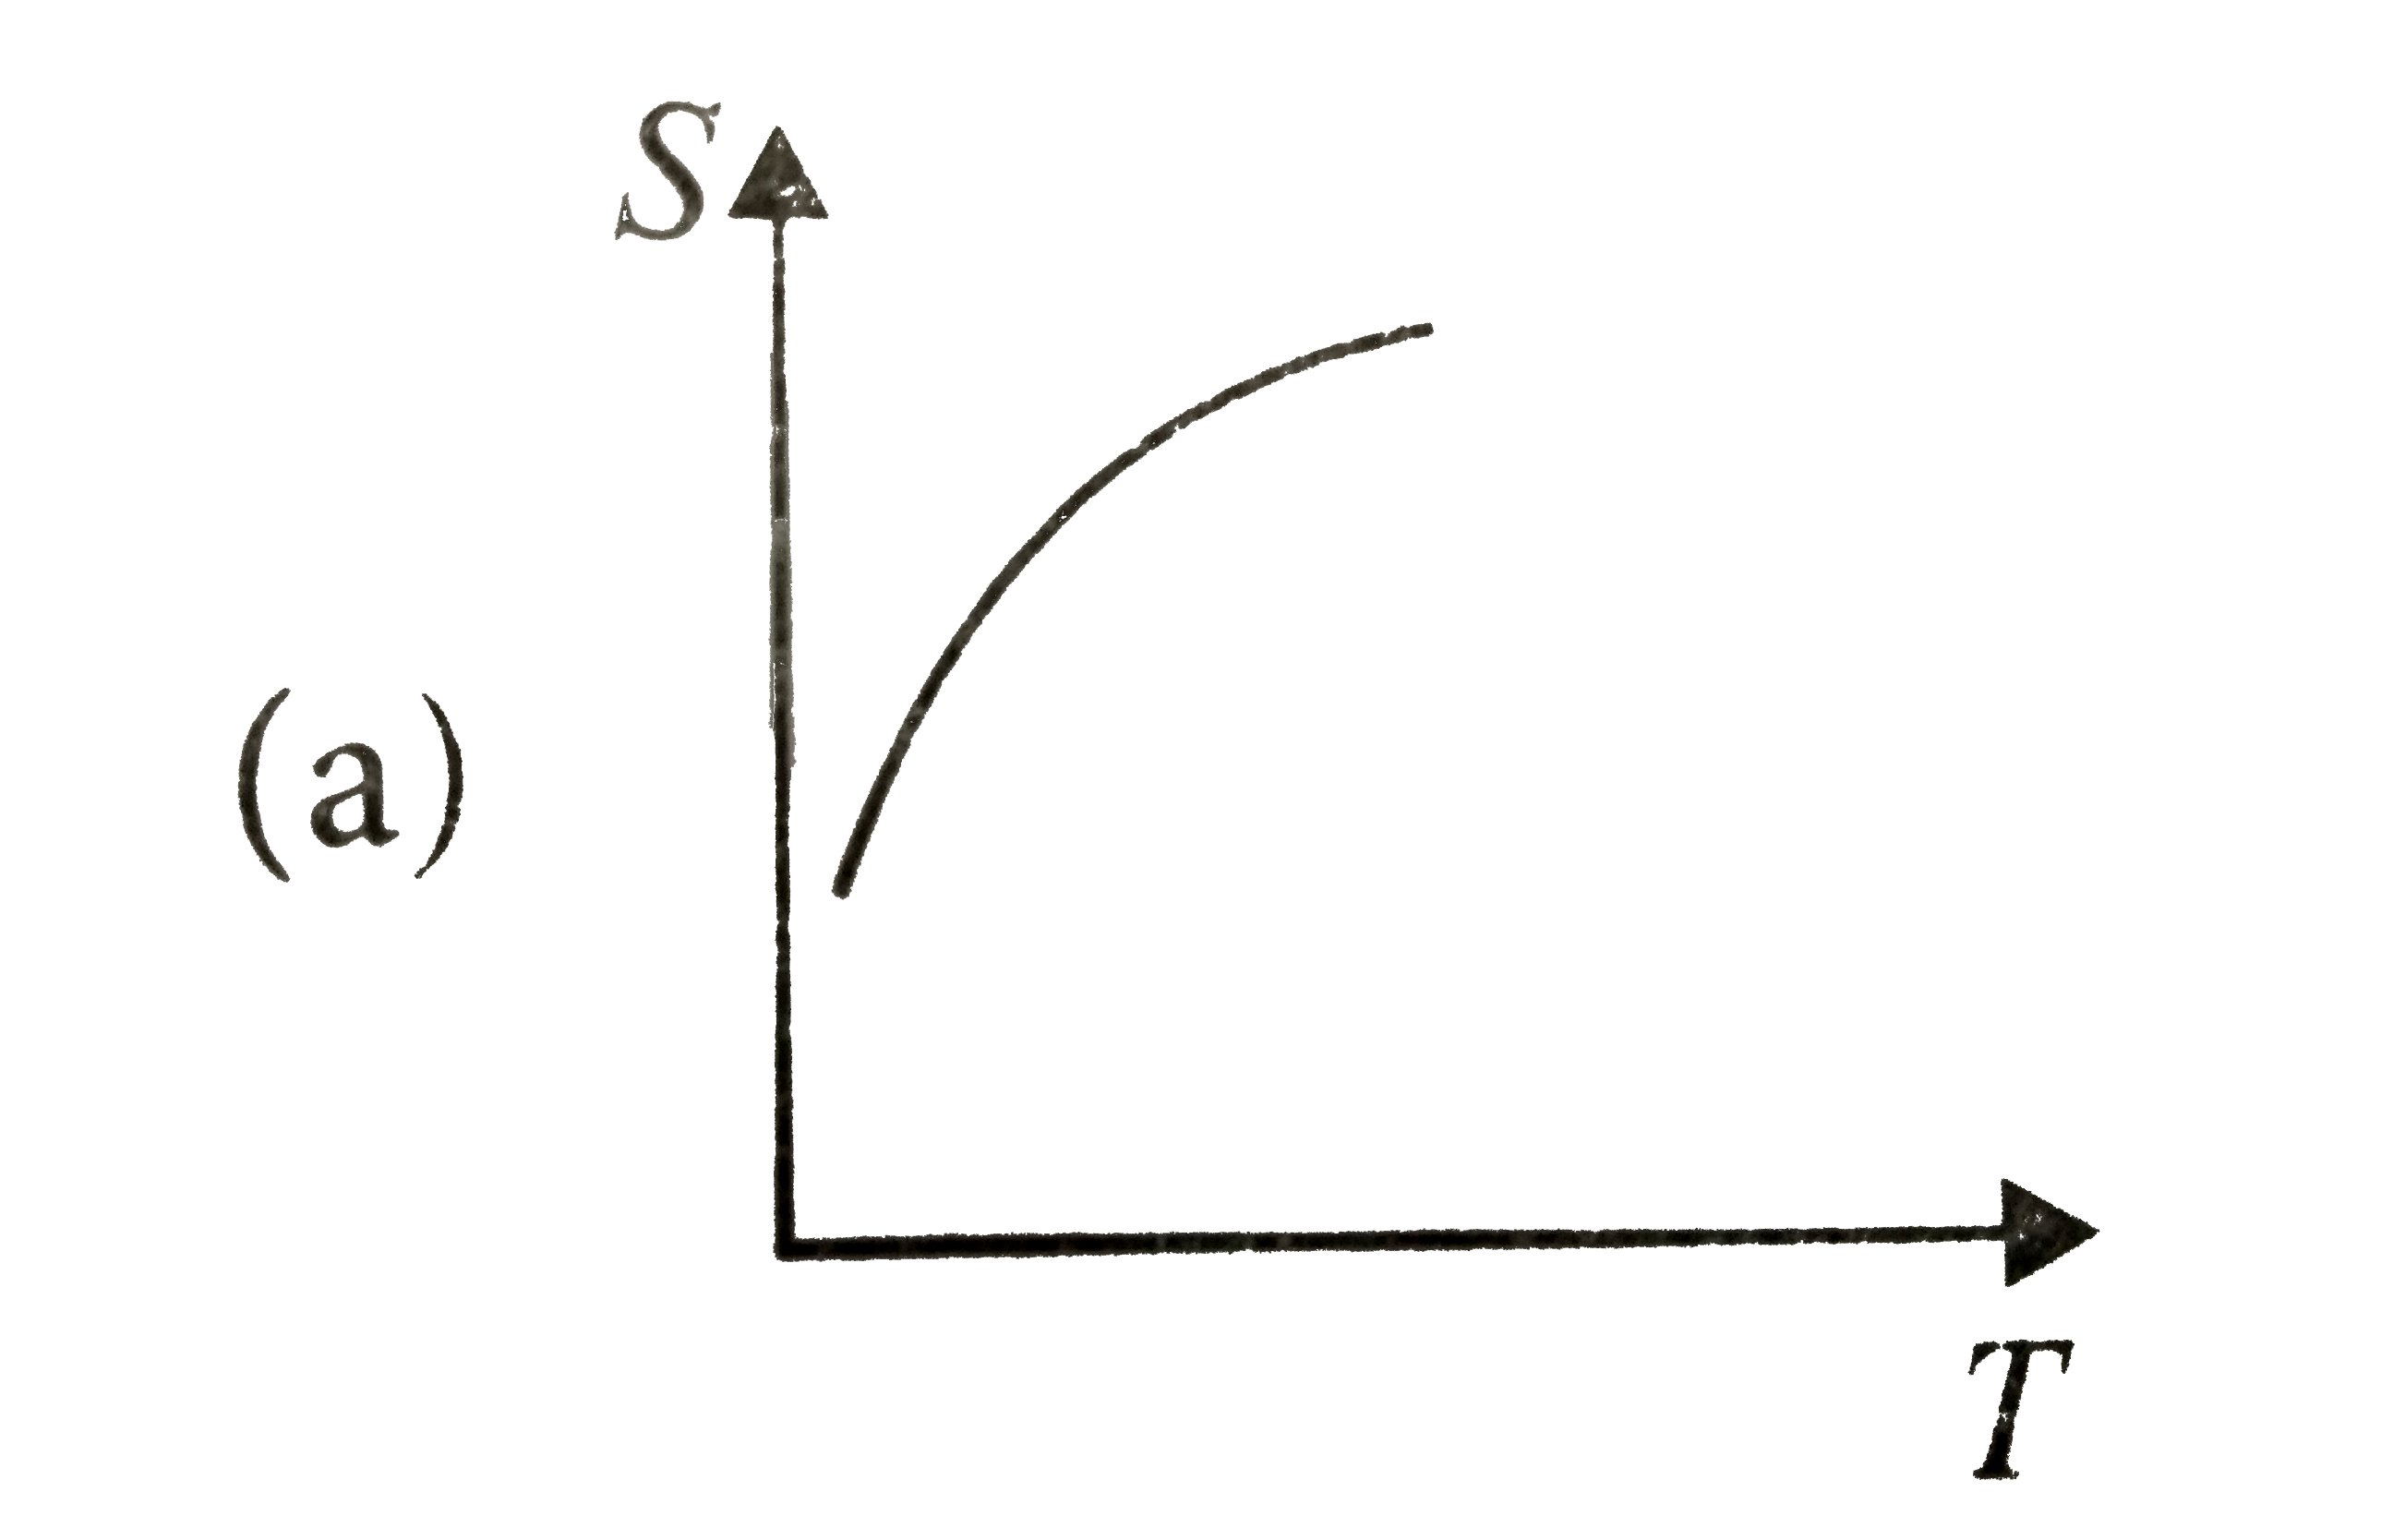
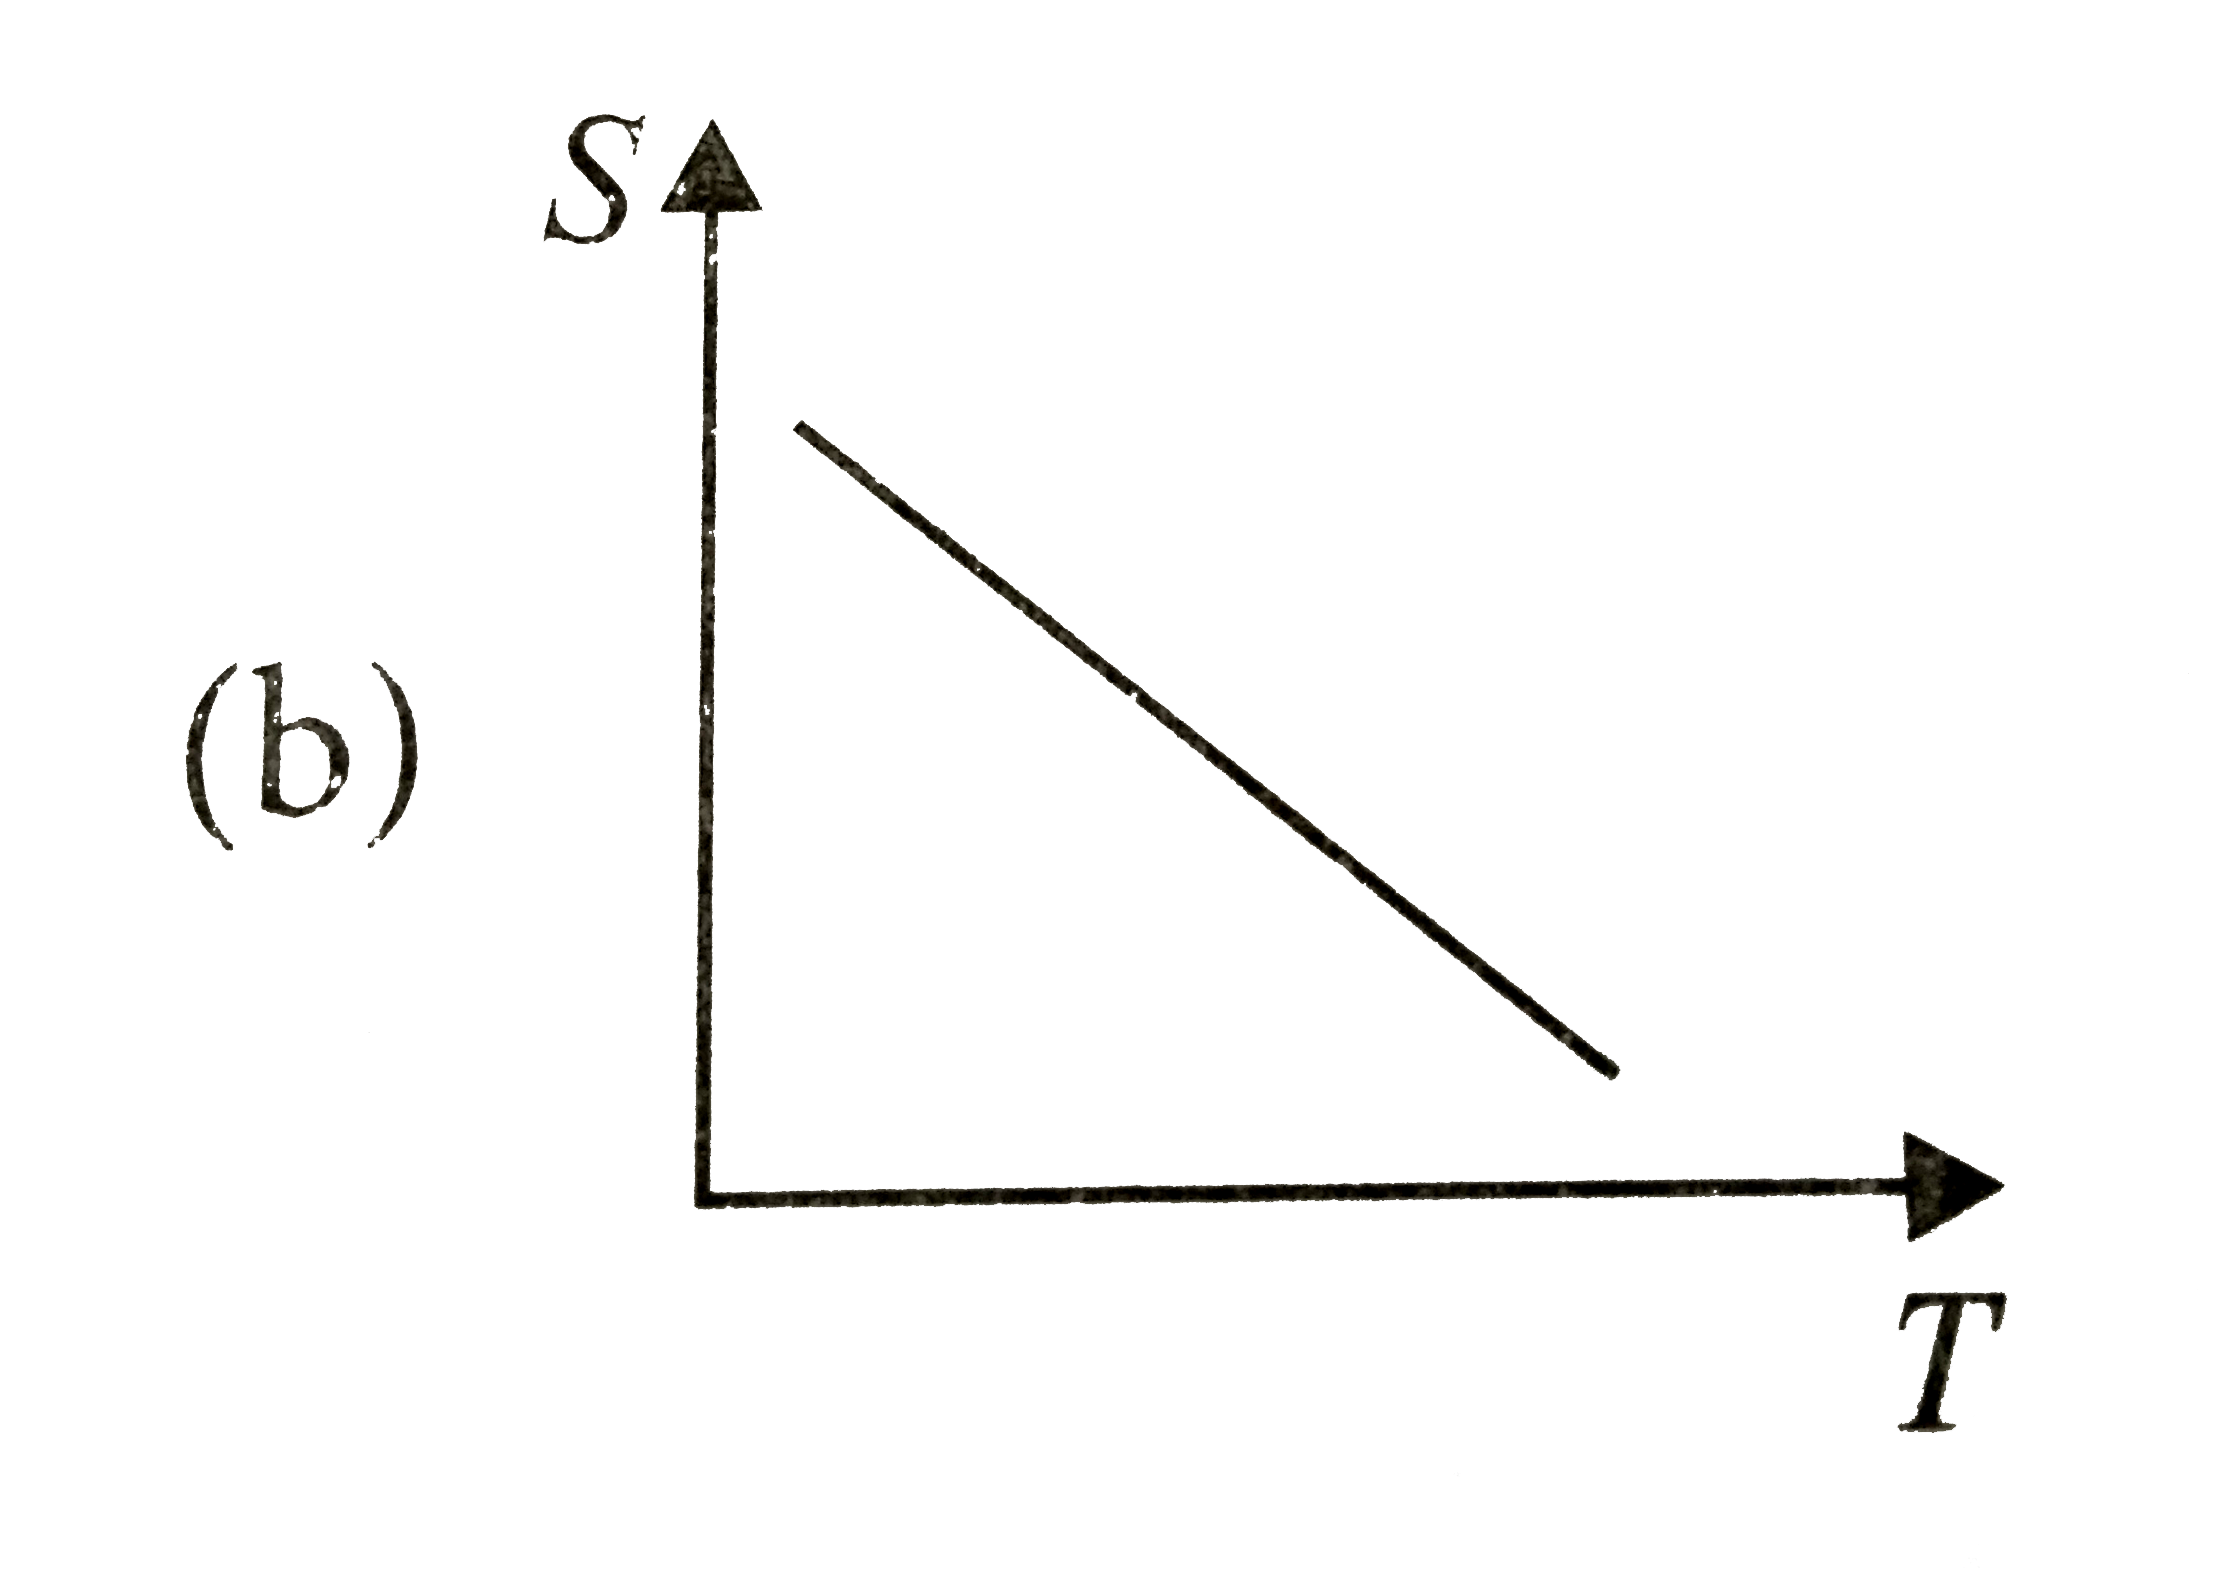
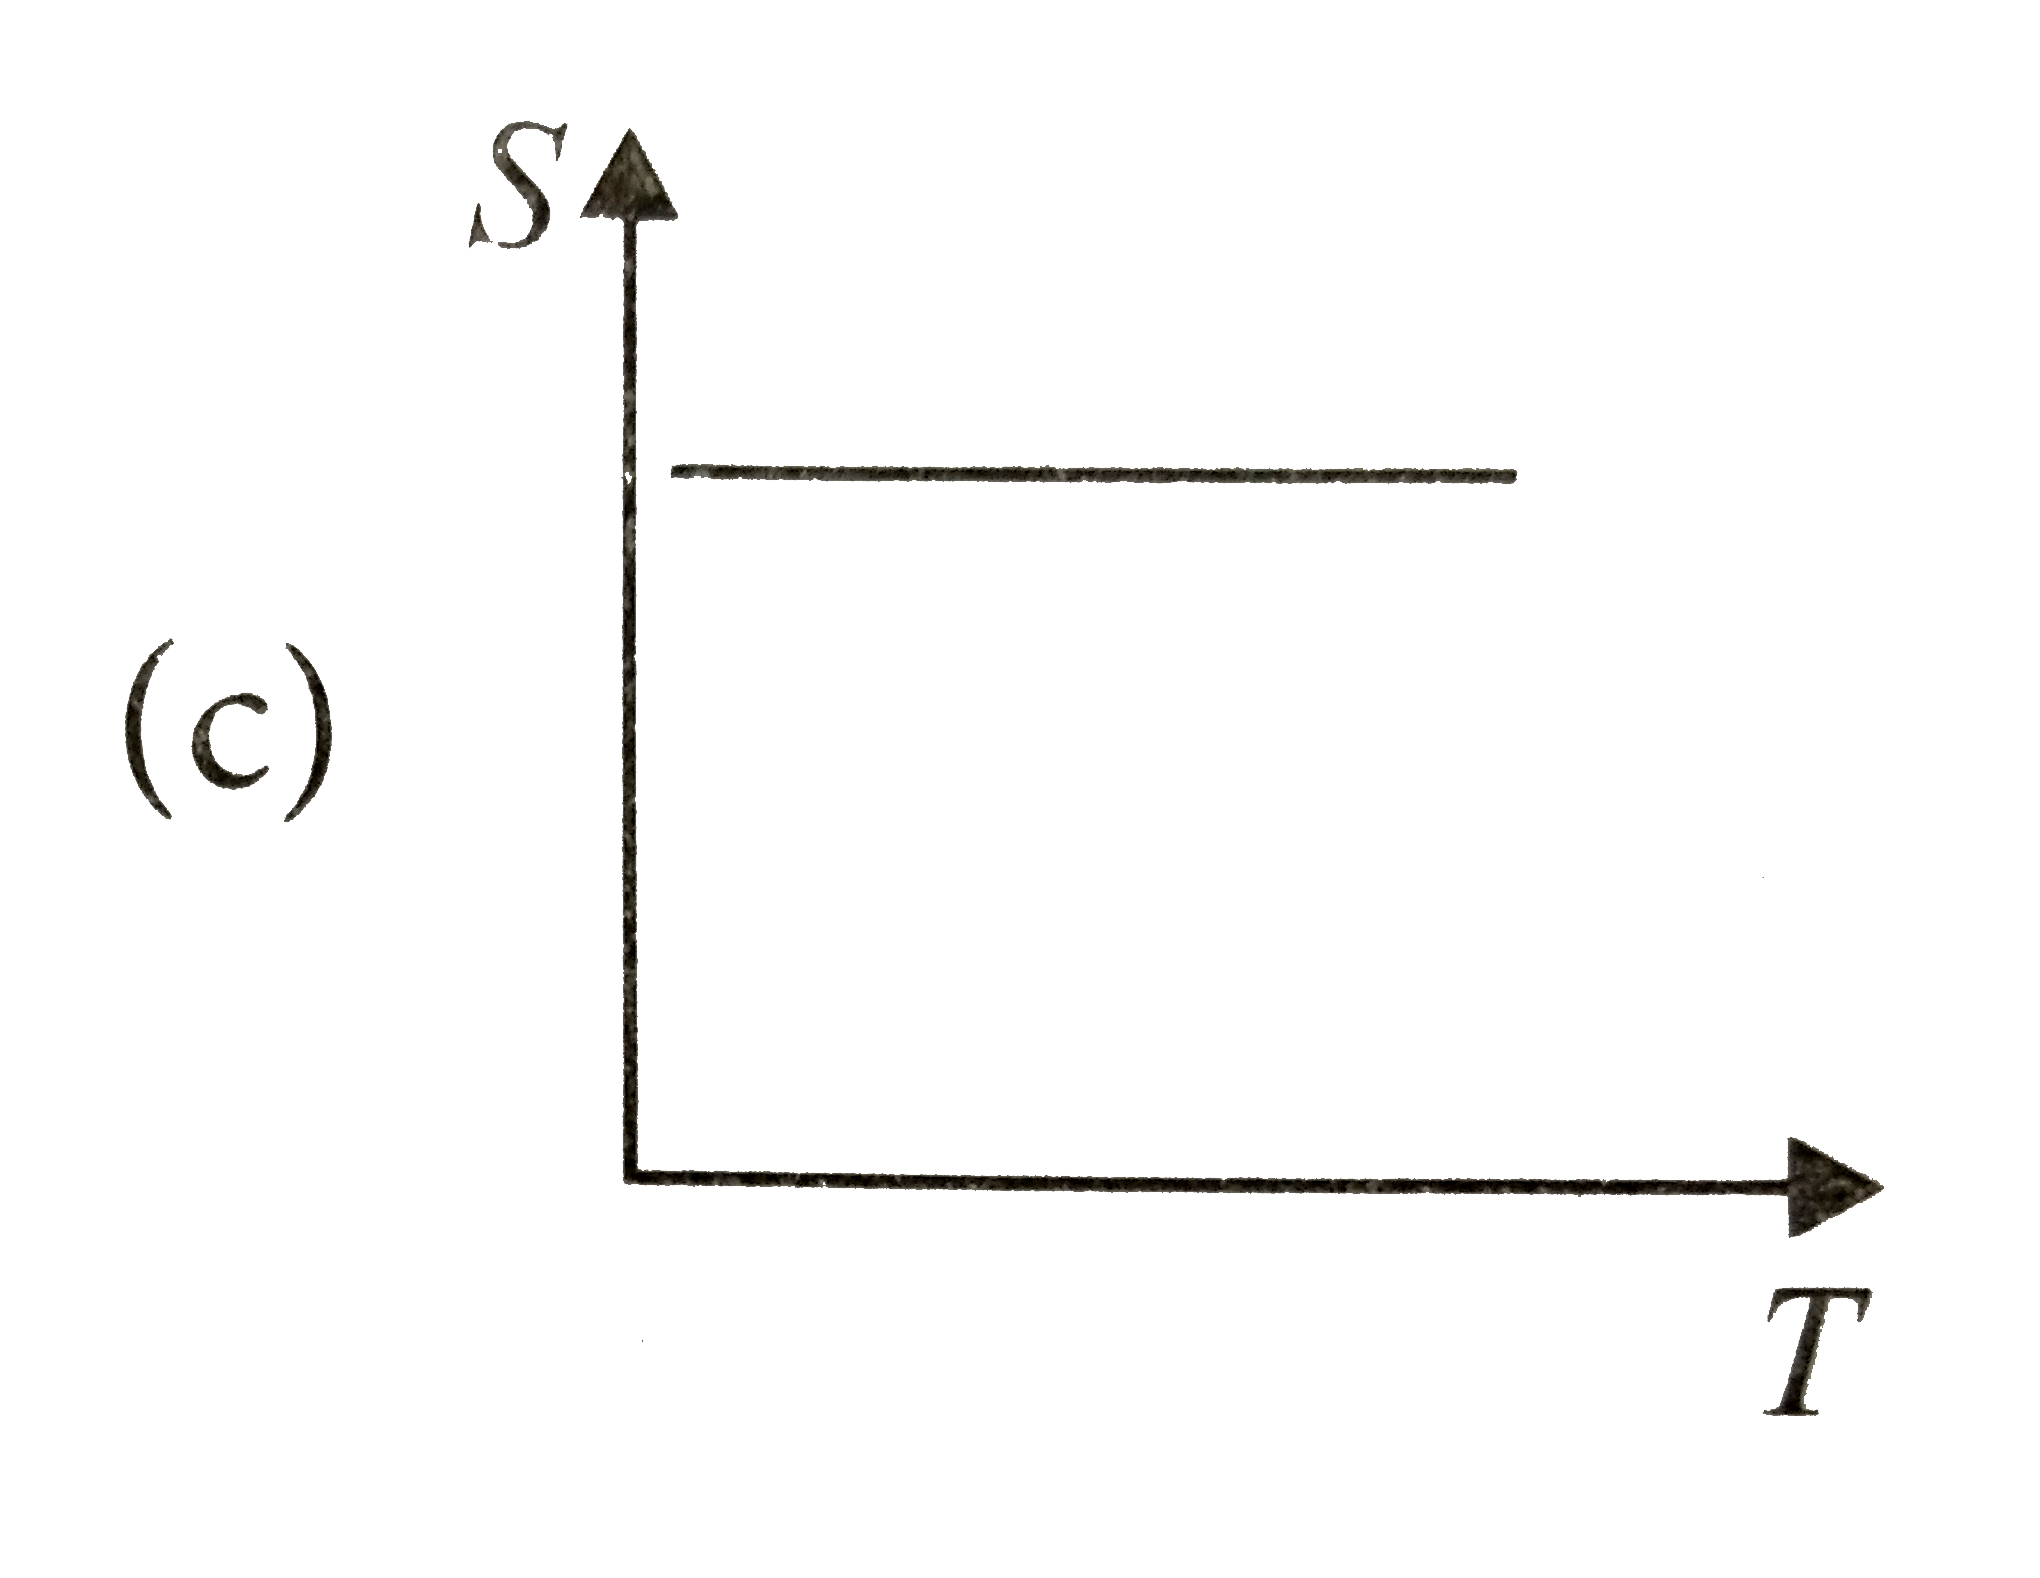
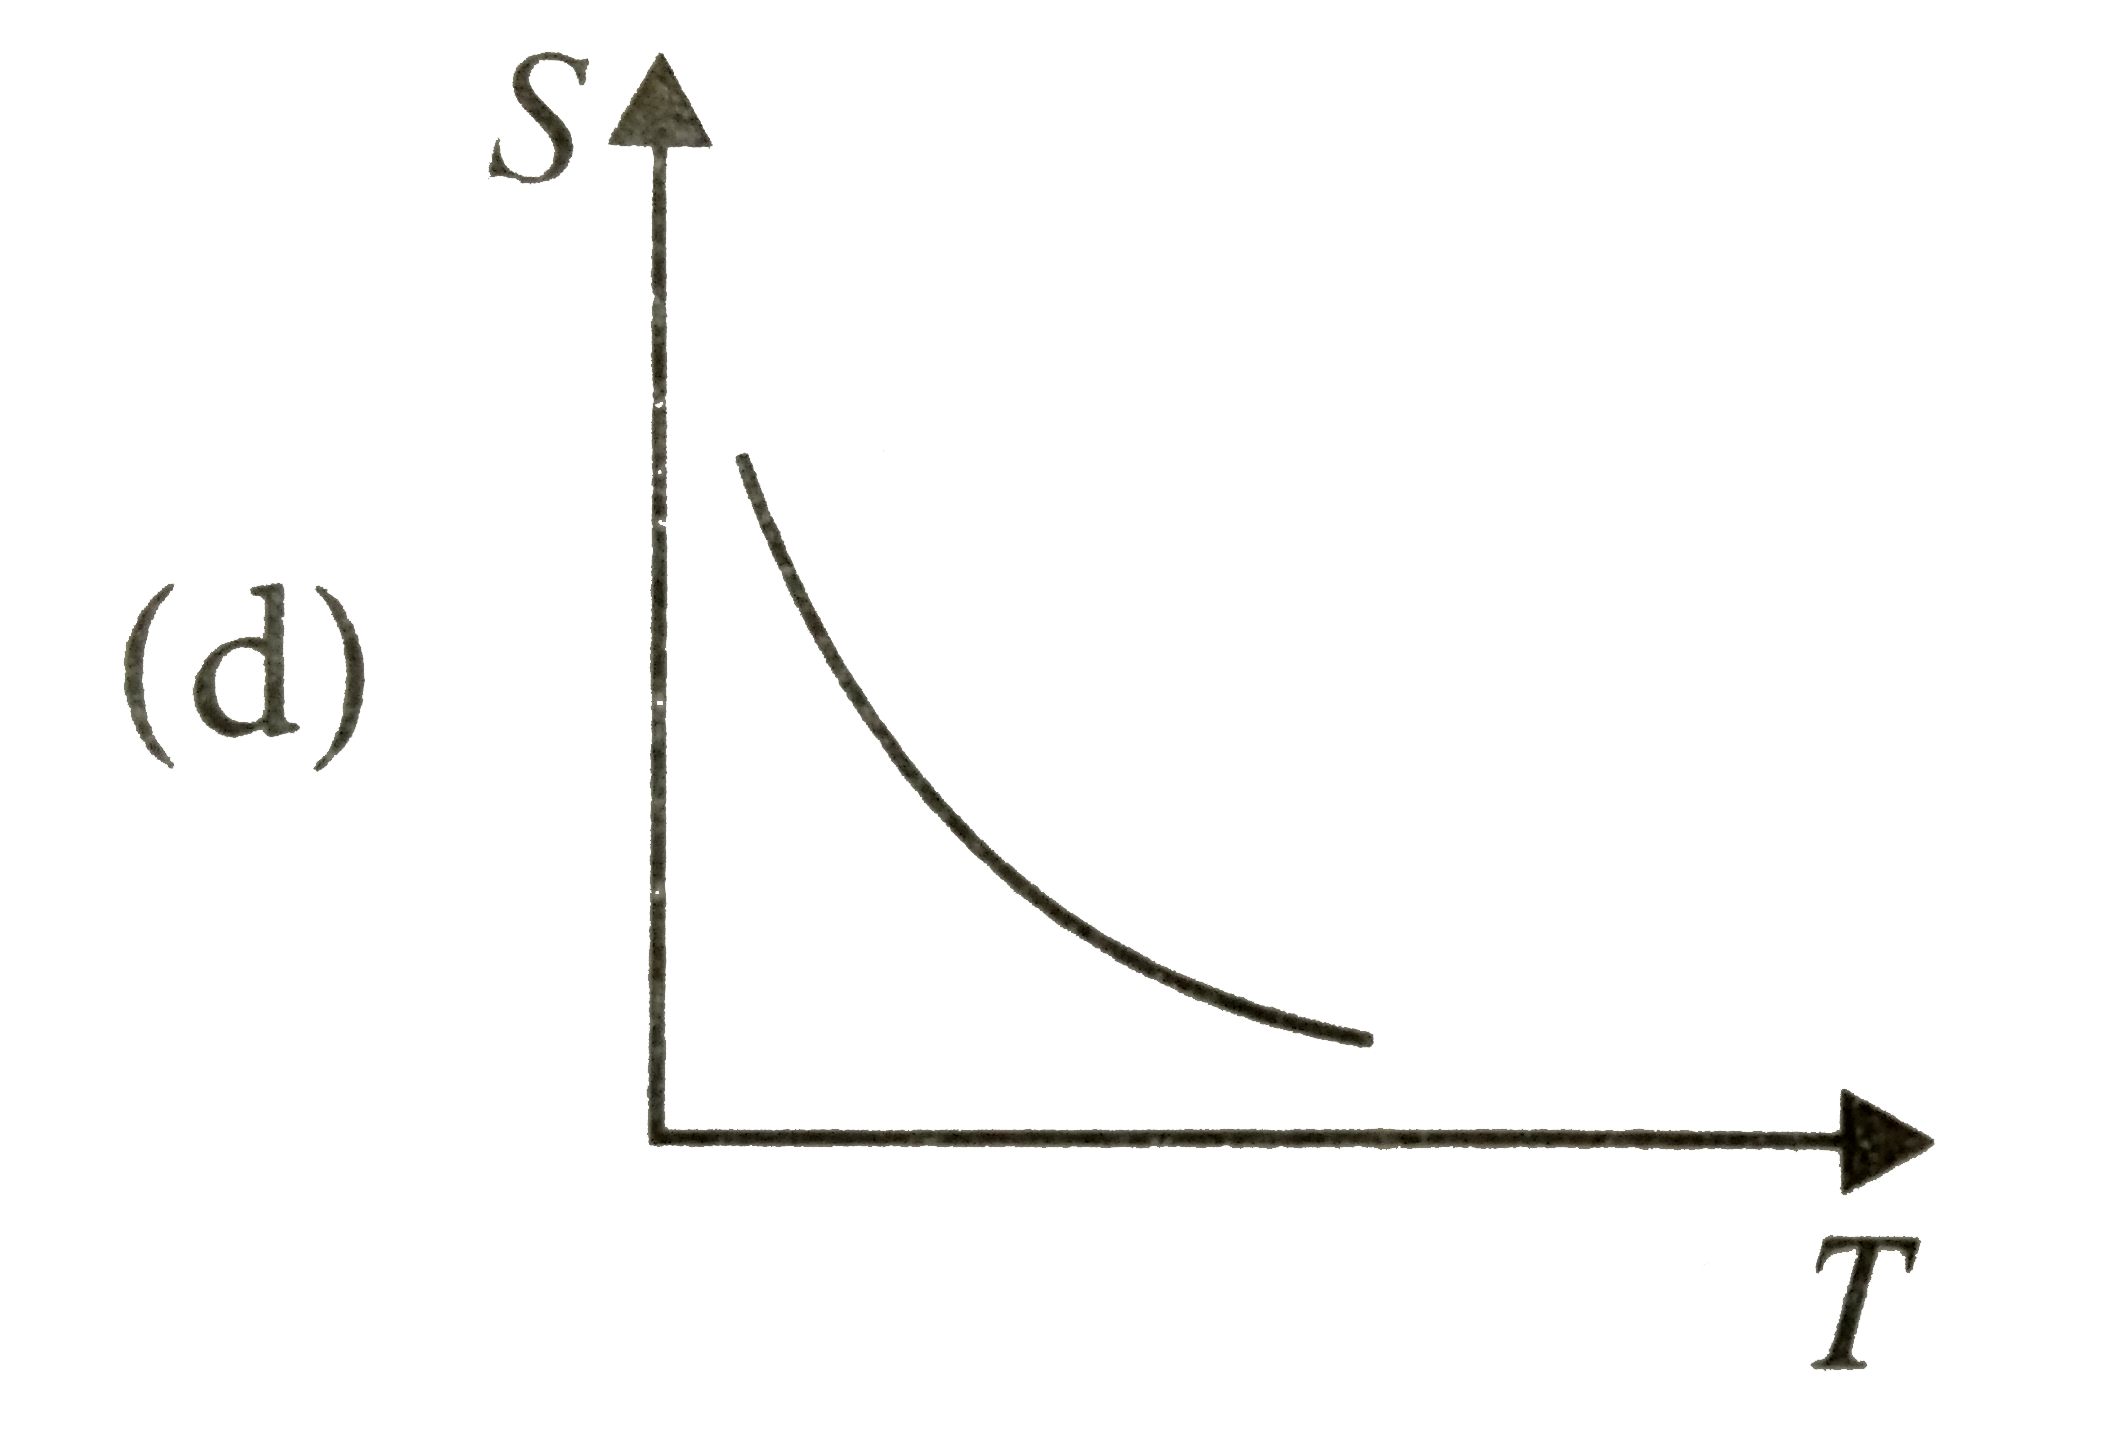
The graph between resistivity and temperature, for a limited range of temperature, is a straight line for a material like
A
copper
B
nichrome
C
silicon
D
mercury
Text Solution
The correct Answer is:B
For a limited range of temperature, the graph between resistivity and temperature is a straight line for a material like nichrome as shown in the figure.

|
Similar Questions
Knowledge Check
The resistivity of a semiconductor at room temperature is in between
A1010 to 1012Ω cmB106 to 108Ω cmC10−3 to 106Ω cmD10−2 to 10−5Ω cmWhich graph represents the variation of surface tension with temperature over small temperature ranges for water?
A B
B C
C D
D
Show variation of resistivity of copper as a function of temperature in a graph.
View SolutionShow variation of resistivity of copper as a function of temperature in a graph.
View SolutionShow variation of resistivity of SI with temperature in a graph.
View SolutionWhich graph represents the variation of surface tension with temperature over small temperature ranges for water?
View SolutionShow on a graph the variation of resistivity with temperature for a typical semiconductor
View SolutionShow on a graph, the variation of resistivity with temperature for a typical semiconductor.
View Solution

