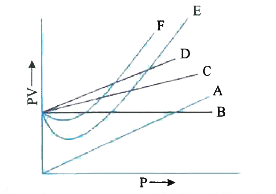
Which one of the following graphs represents the behaviour of an ideal gas.
A

B

C

D

Text Solution
The correct Answer is:C
For an ideal gas PV = constant . i.e ., PV doesn't vary with V.
|
Similar Questions
Knowledge Check
Which of the following graphs represent the behaviour of an ideal gas ?
A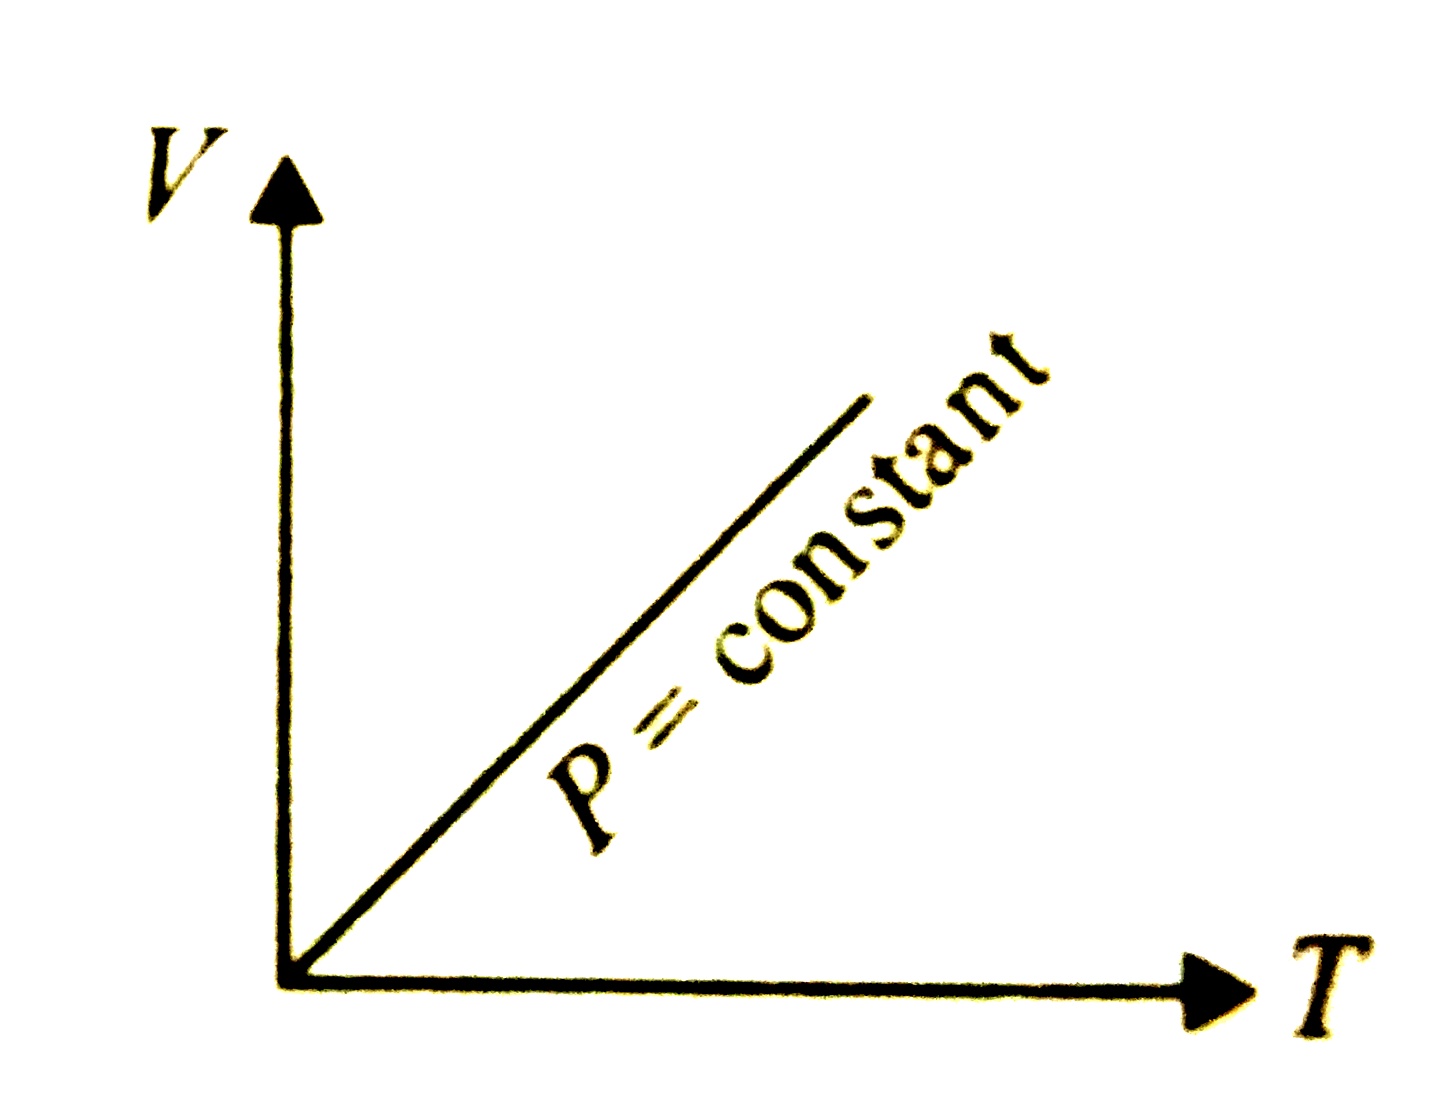 B
B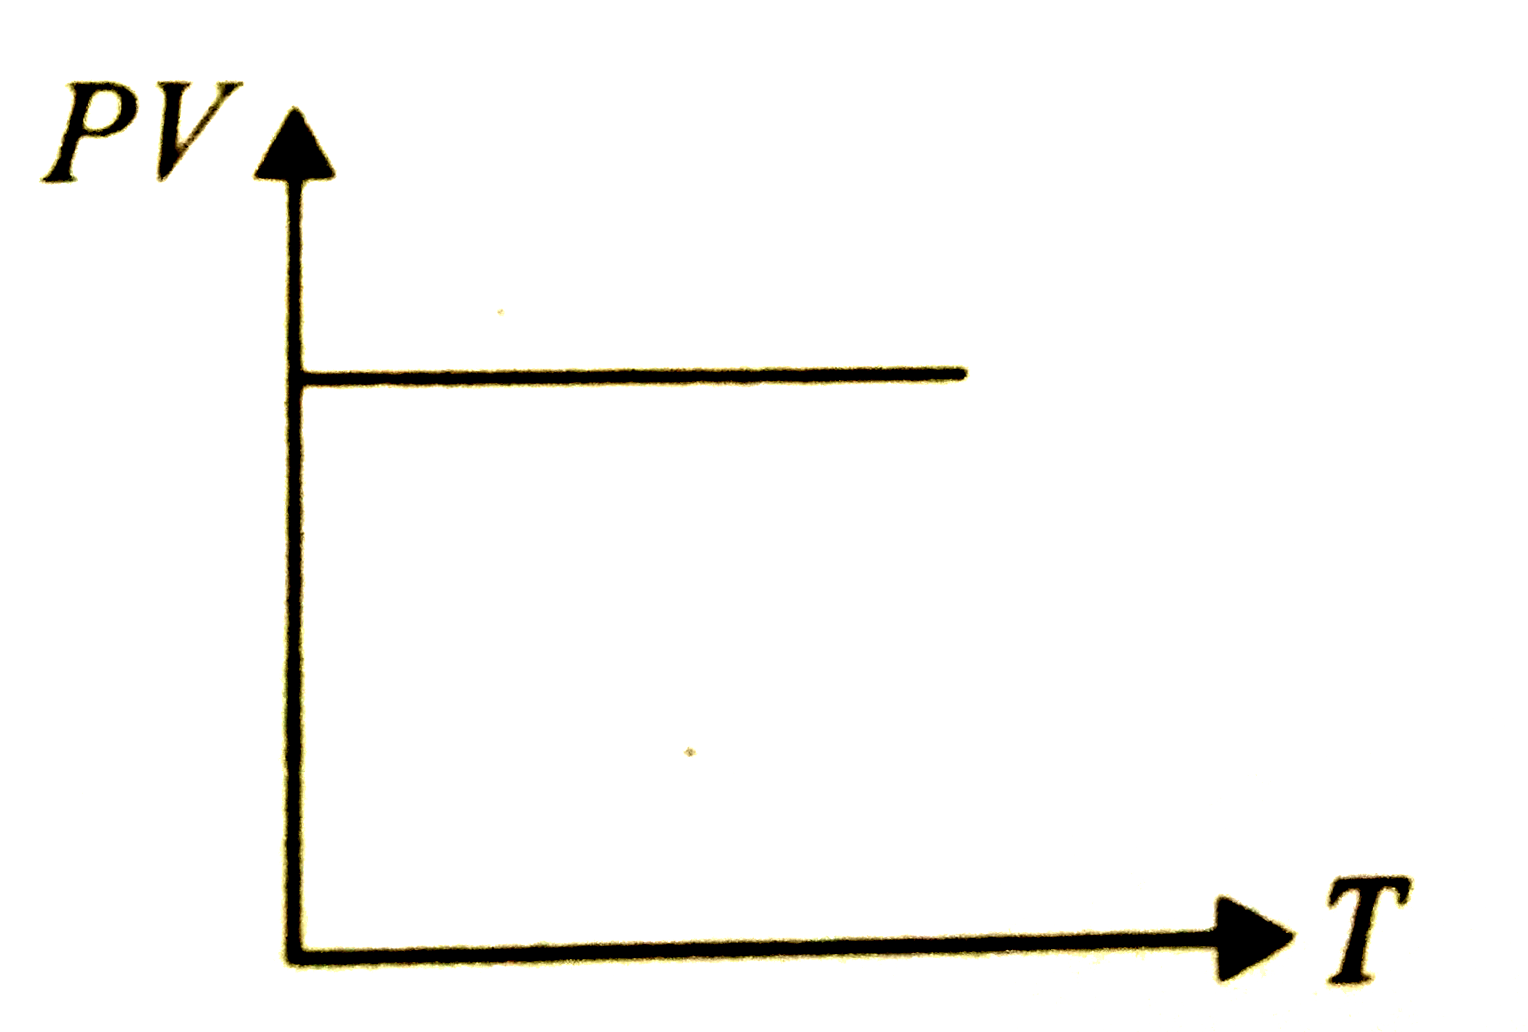 C
C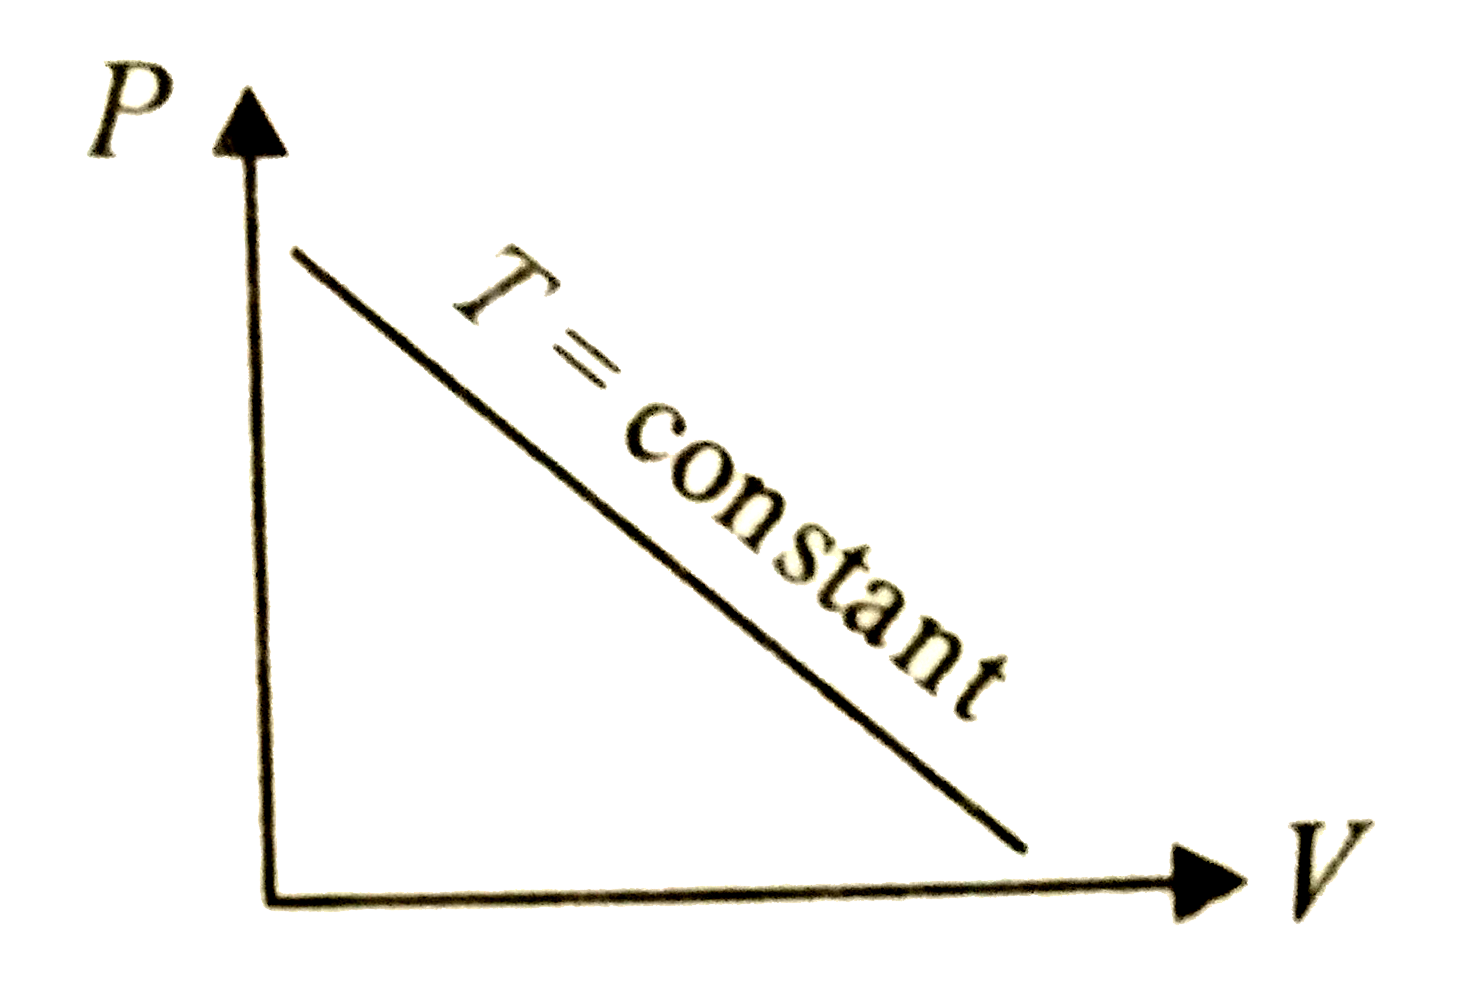 D
D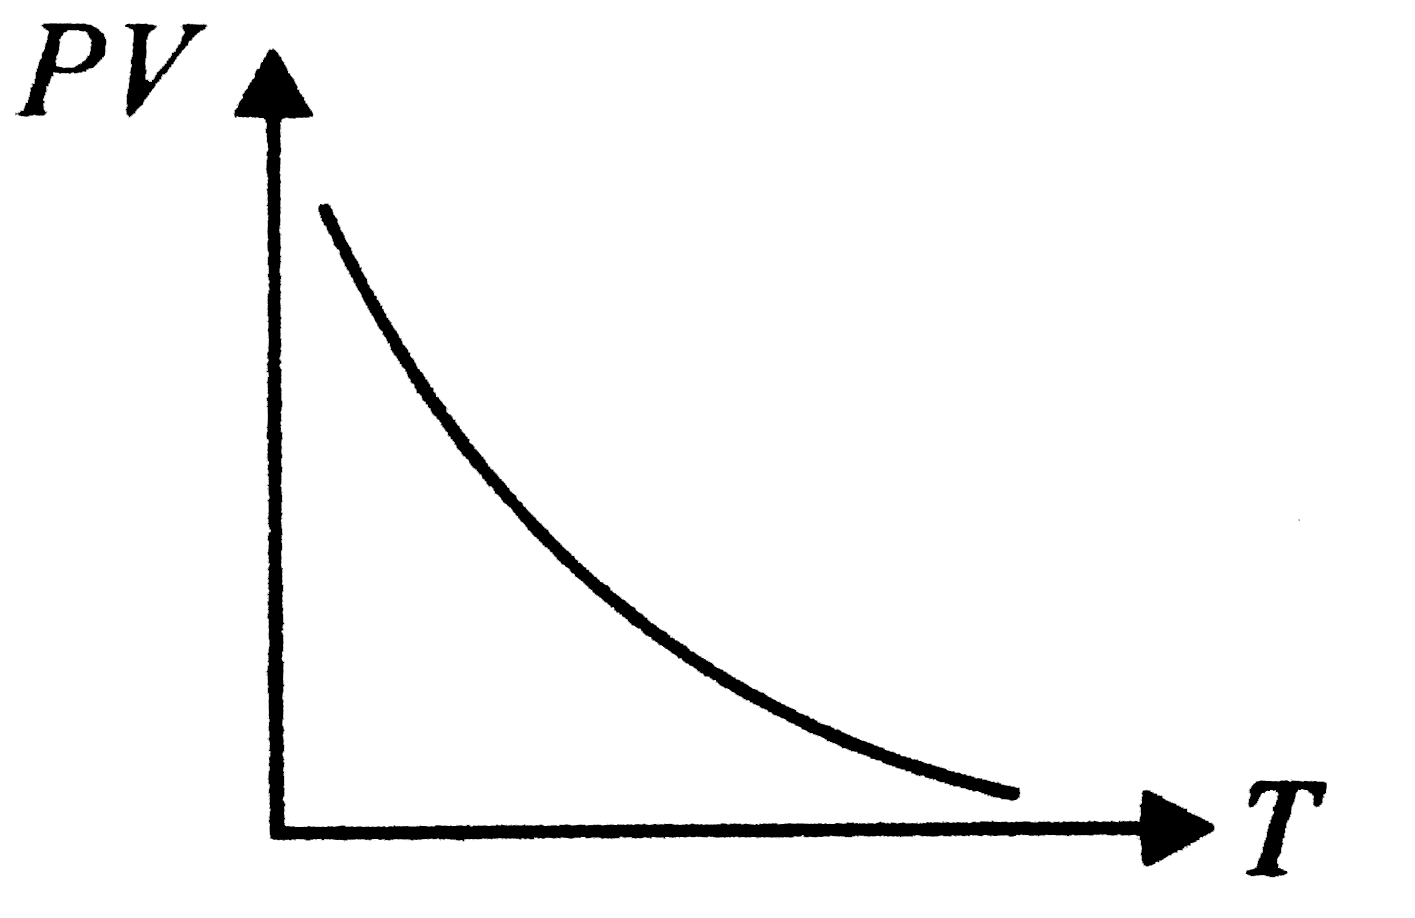
Which of the following graphs represent the behaviour of an ideal gas ?
A1. B2.
B2. C3.
C3. D4.
D4.
Which of the following plots represents the behavior of an ideal binary liquid solution ?
APlot of PtotalvsYA (mol-fraction of A in vapour phase) is linearBplote of PtotalvsYB is linearCPlote of 1/PtotalvsYA is linearDPlote of 1/PtotalvsYB is non-linear
The graph that does represent the behaviour of an ideal gas is :
View SolutionWhich curve in the following graph represents the curve of ideal gas ?
View SolutionThe graph that does not repersent the behaviour of an ideal gas is-
View SolutionWhich of the following graphs correctly represents the variation of β=−(dVdP)1V with P for an ideal gas at constant temperature ?
View SolutionWhich one of the following graphs correctly gives the ideal gas behaviour ?
View Solution

