The following table shows frequency distribution of the number of saplings planted by the students of a school :

Find the modal number of saplings planted.
The correct Answer is:Modal number of saplings is 25.
Step by step video & image solution for The following table shows frequency distribution of the number of saplings planted by the students of a school : Find the modal number of saplings planted. by Maths experts to help you in doubts & scoring excellent marks in Class 10 exams.
Updated on:21/07/2023Topper's Solved these Questions
- STATISTICSBook:NAVNEET PUBLICATION - MAHARASHTRA BOARDChapter:STATISTICSExercise:EXAMPLES
Explore 3 Videos
- STATISTICSBook:NAVNEET PUBLICATION - MAHARASHTRA BOARDChapter:STATISTICSExercise:MISCELLANEOUS
Explore 24 Videos
- STATISTICSBook:NAVNEET PUBLICATION - MAHARASHTRA BOARDChapter:STATISTICSExercise:Assignment 6.3
Explore 4 Videos
- SIMILARITYBook:NAVNEET PUBLICATION - MAHARASHTRA BOARDChapter:SIMILARITYExercise:SUBJECTIVE TYPE
Explore 20 Videos
- THEOREMS Book:NAVNEET PUBLICATION - MAHARASHTRA BOARDChapter:THEOREMS Exercise:CIRCLE
Explore 15 Videos
Similar Questions
Knowledge Check
The following table gives the frequency distribution of number of peas per pea pod of 198 pods :

What is the median of this distribution ?A3B4C5D6Read the following table carefully and answer the questions given below.

If the number of appeared students from school A in 2000 and number of appeared students from school C in 1999 are equal, what is the respective ratio between the number of passed students from school A in 2000 and number of passed students from school C in 1999 ?A3:4B5:6C1:2DCant't be determined
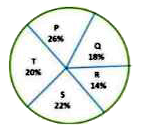
The following pie-chart shows the percentage-wise distribution of the number of students in five different schools P, Q, R, S and T. The total number of students in all five schools together is 8400.

Find the average number of students in schools R and S together.
View SolutionThe frequency distribution table shows the number of mango trees in a grove and their yield of mangoes. Find the median of data.

View SolutionThe frequency distribution table shows the number of mango trees in a grove and their yield of mangoes. Find the median of data.

View SolutionThe frequency distribution table shows the number of mango tree in a grove and their yield of mangoes.Find the megian of data.

View SolutionThe following table shows frequency distribution of marks of 100 students of 10th class which they obtianed in a practice examination. Find the median of the marks.

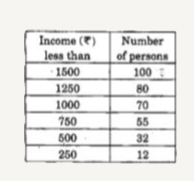
View SolutionThe following table gives less than' type frequency distribution of income per day:

What is the modal class ?
View Solution

