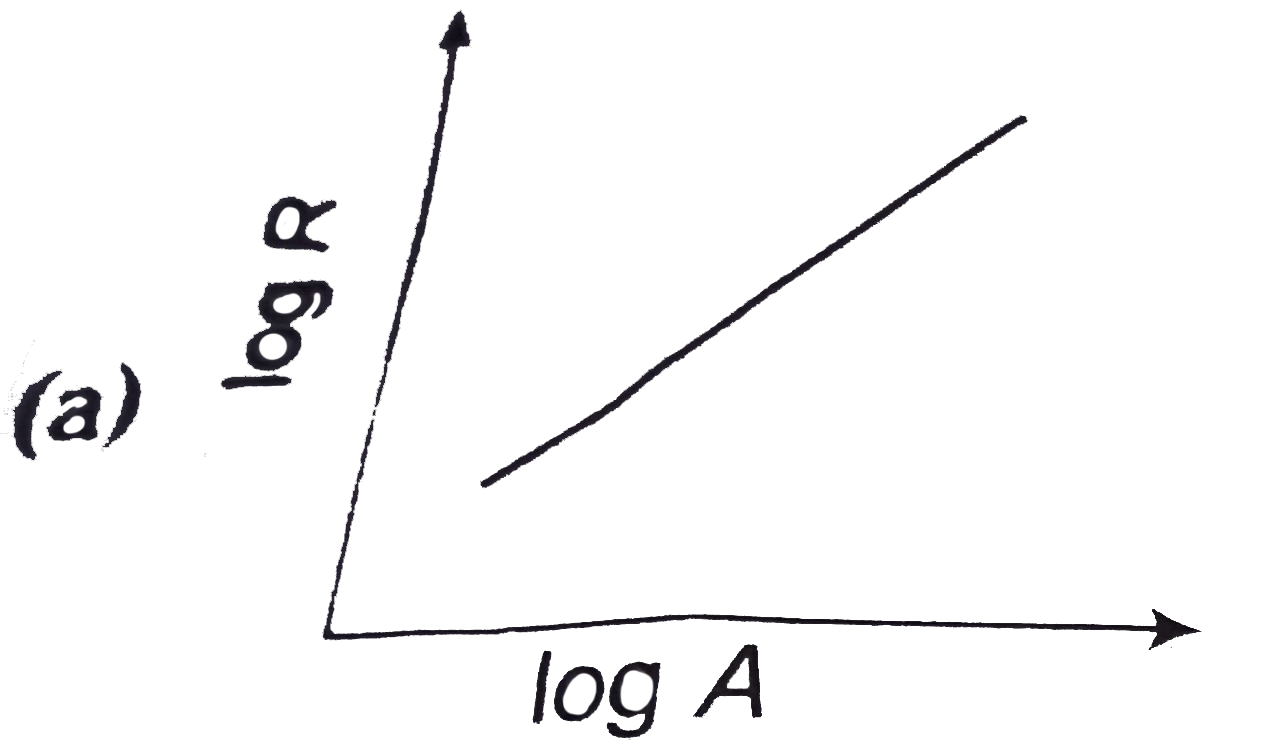
The graph between log R and log A wher R is the nuclear radius and A is the mass of is.
A
B
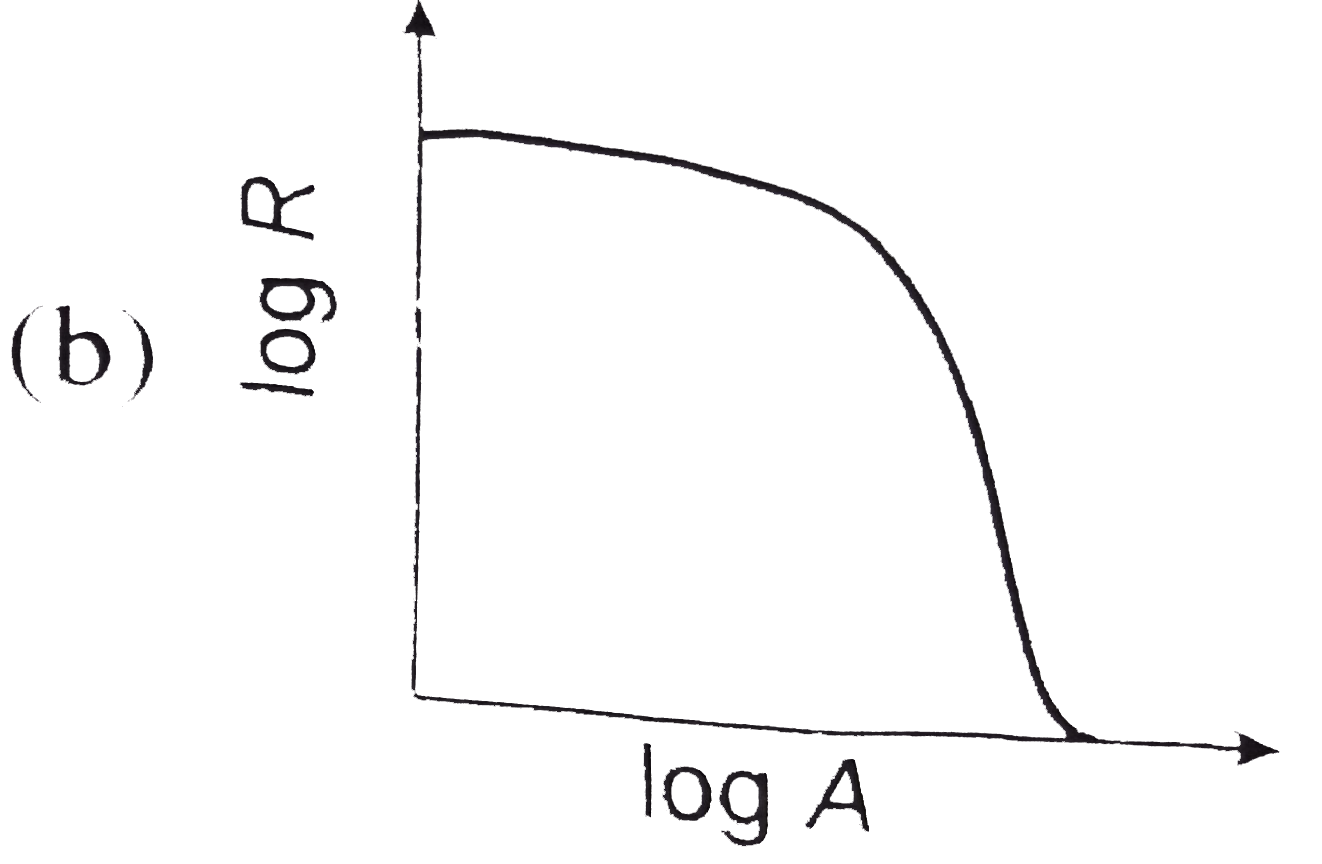
C
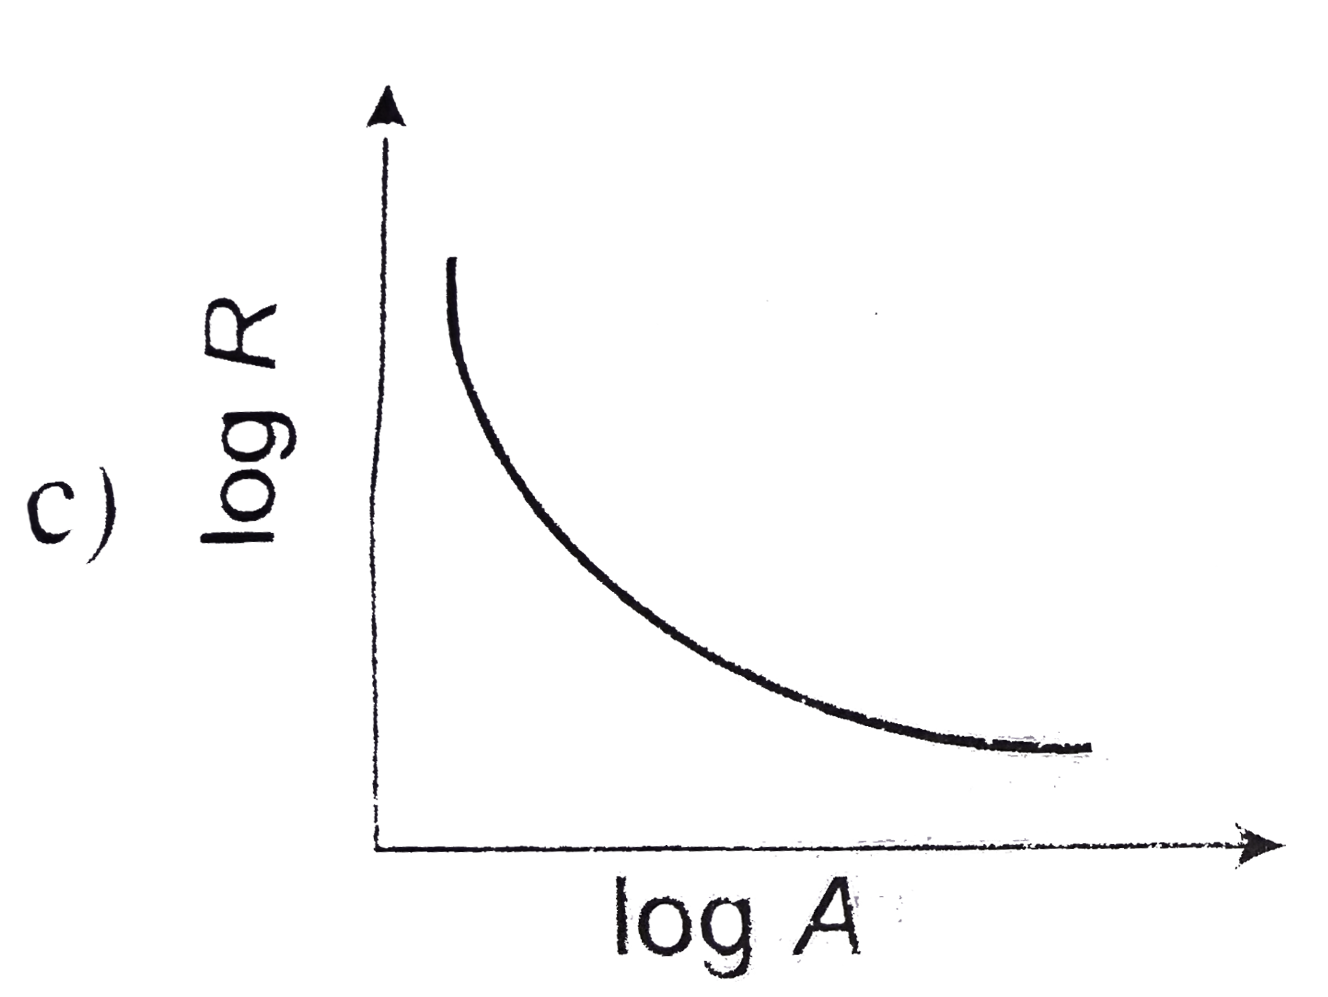
D
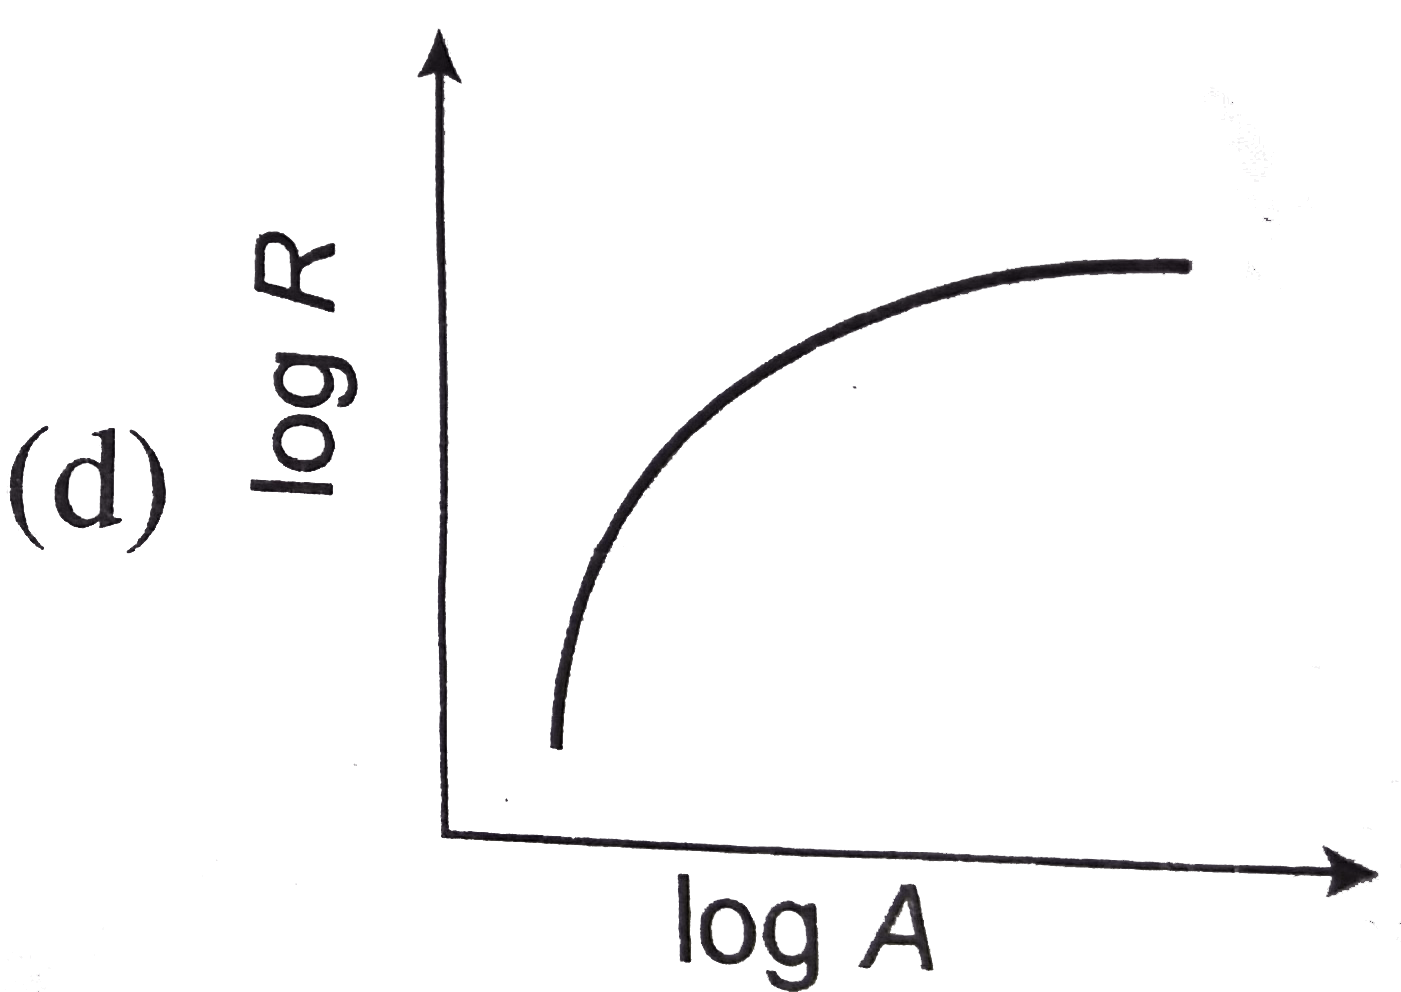
Video Solution
Text Solution
The correct Answer is:A
(a) R=R0A1/3 , where R0=1.2×10⁻¹⁵m.
⇒logeR=logeR0+13logeA
This is the equation of a straight line with positive slope.
|
Similar Questions
Knowledge Check
The graph between log t1/2 and log a at a given temperature is
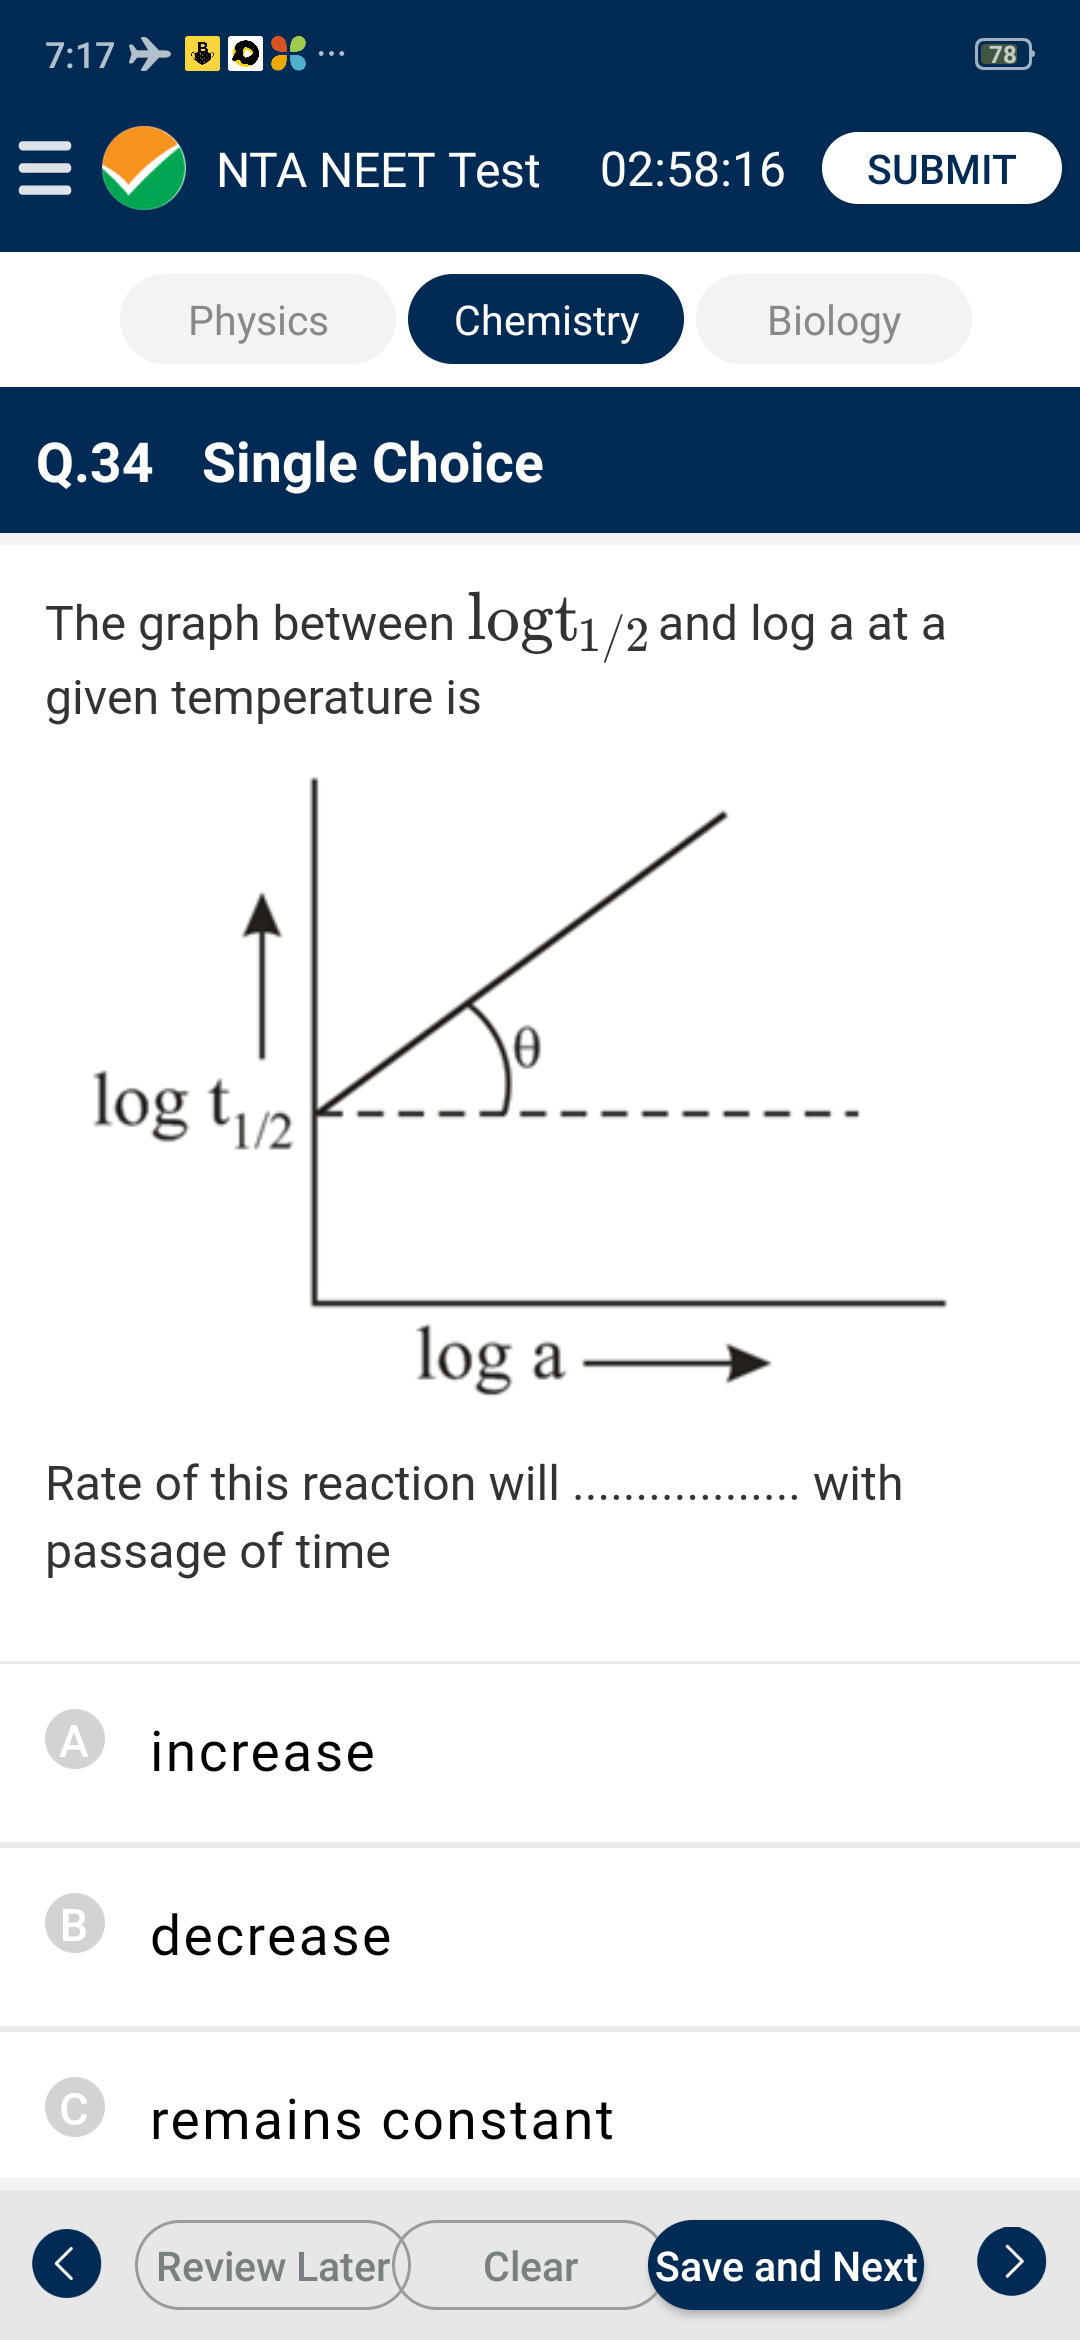
Rate of this reaction will …….with passage of timeAincreaseBdecreaseCremains constantDfirst increase then decreaseThe correct curve between logeR and loge(θ−θo) is -
A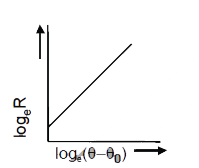 B
B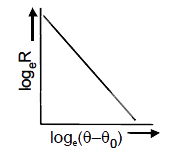 C
C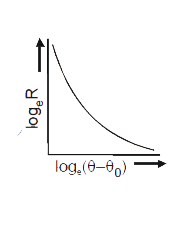 D
D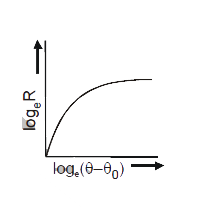
Following is the graph between log T50 and log a (a = initial concentration) for a given reaction at 27∘C.
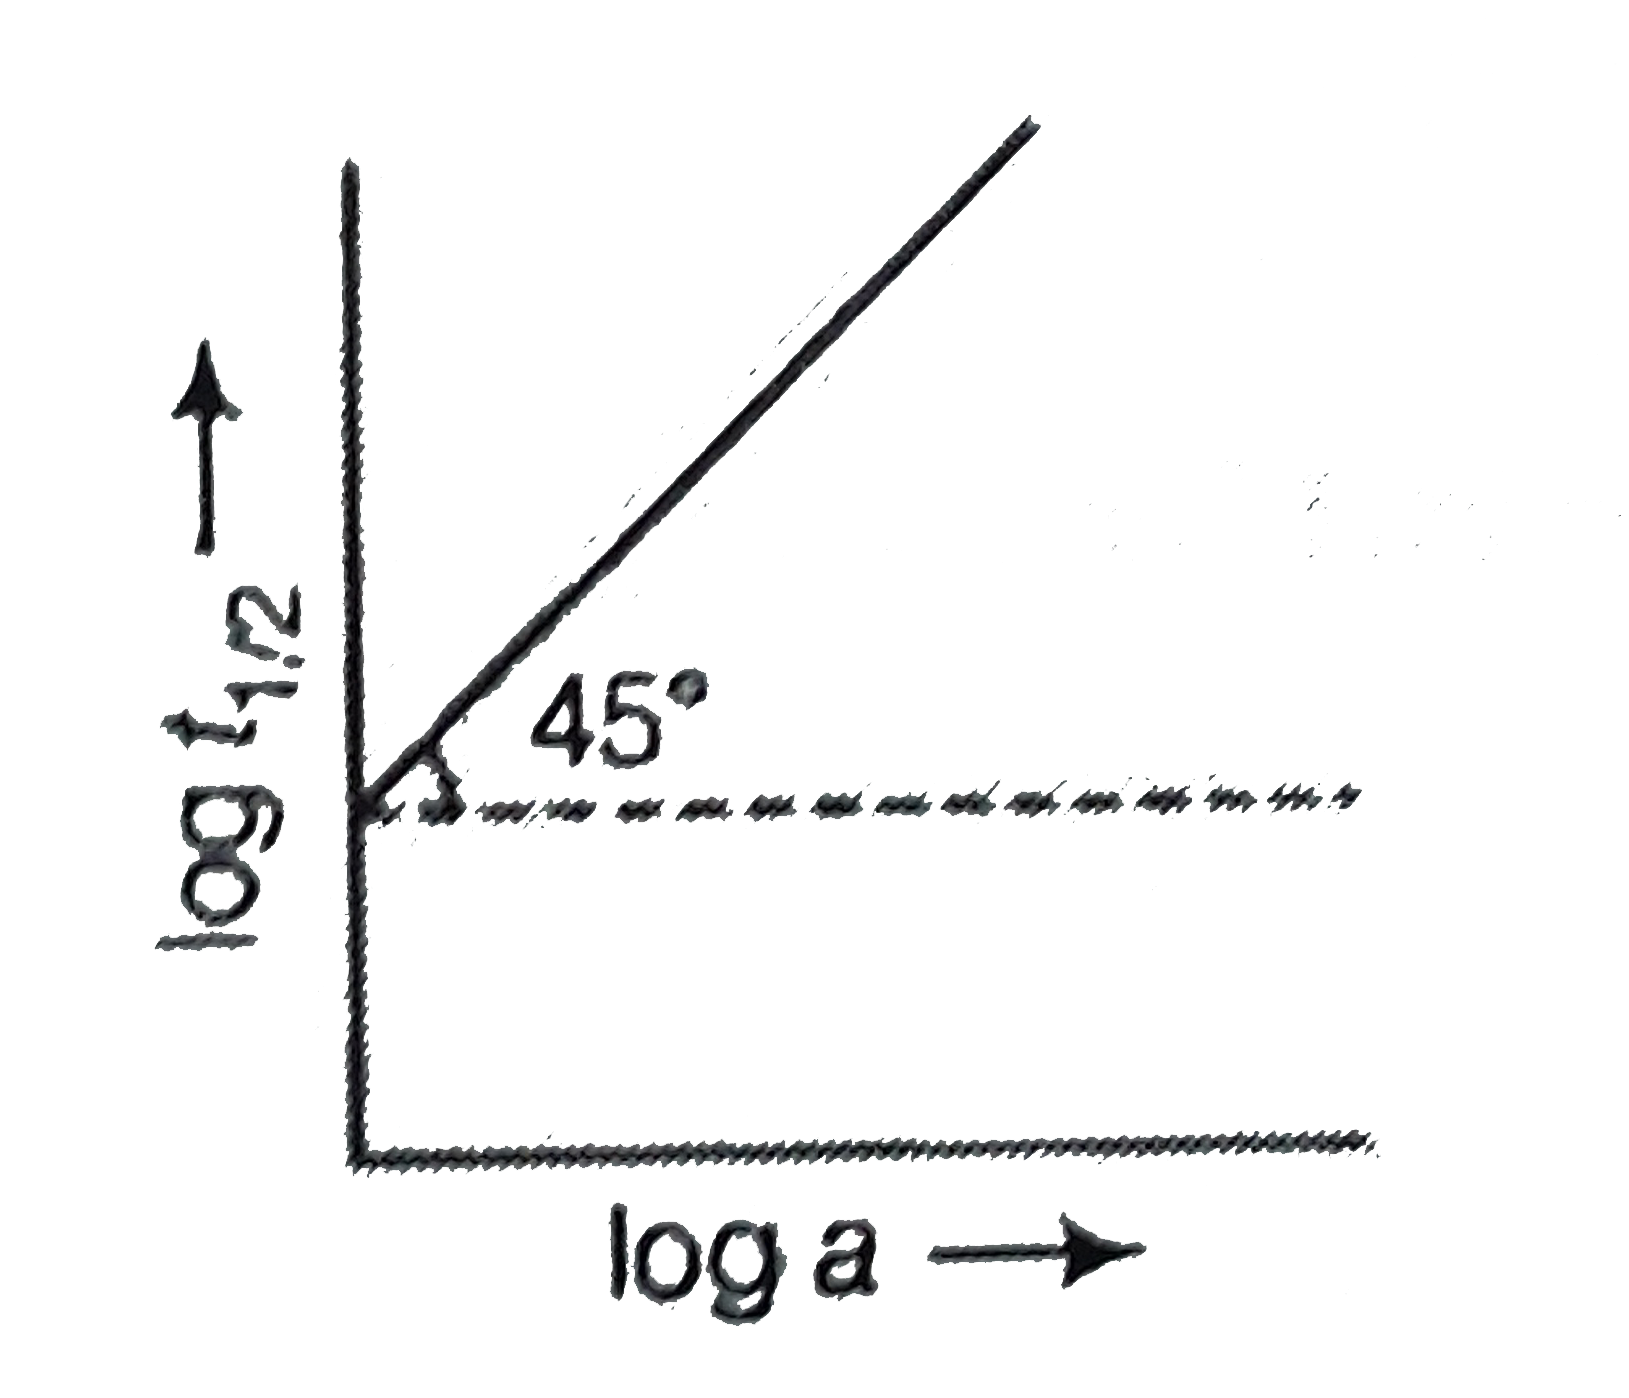
Hence, order isA1B2C3D0
What is the type of graph between log P and log(1V) at constant temperature for a given amount of gas ?
View SolutionWhat is the type of graph between log P and log V at constant temperature?
View SolutionFollowing is the graph between logT50 and loga (a= initial concentration) for a given reaction at 27∘C. Hence order is
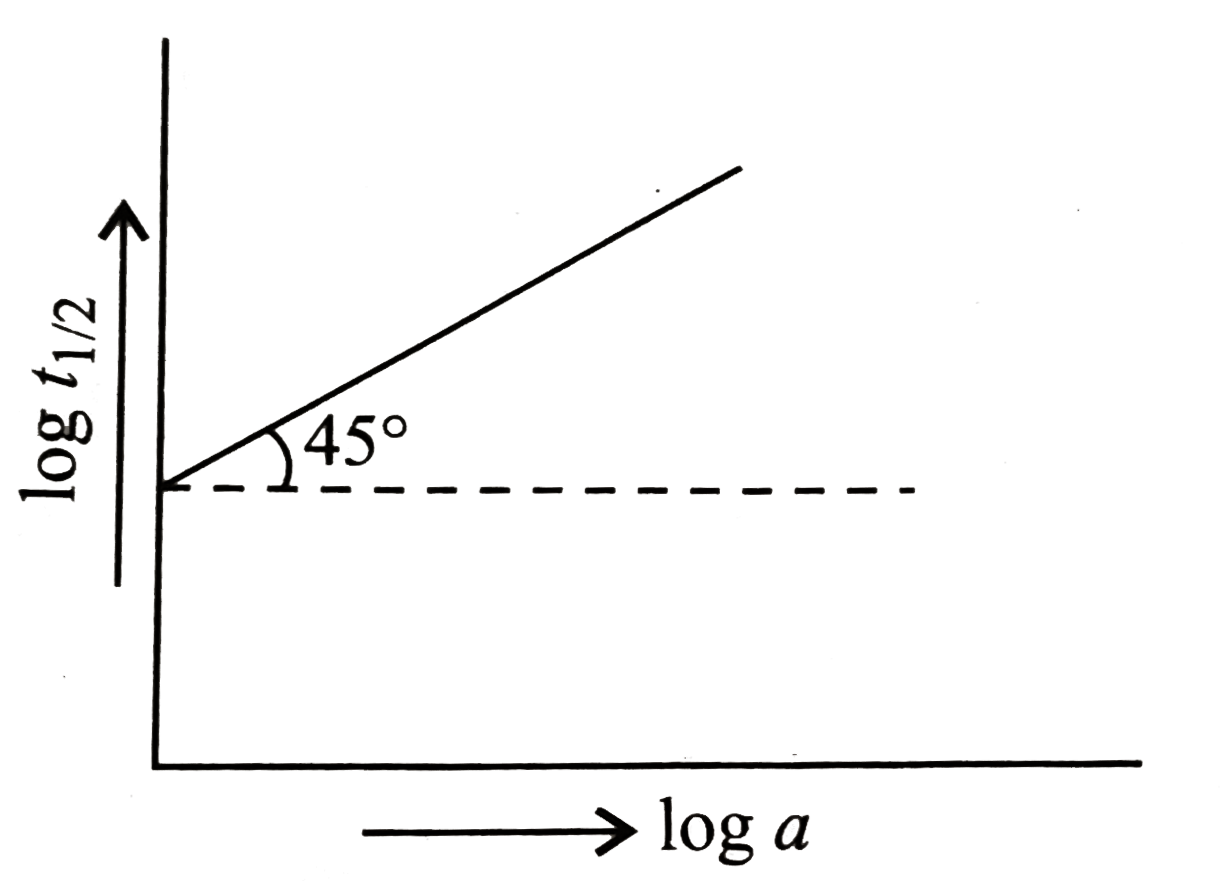
View SolutionA graph between logt12 and log a (abscissa), a being the initial concentration of A in the reaction For reaction A→Product, the rate law is :
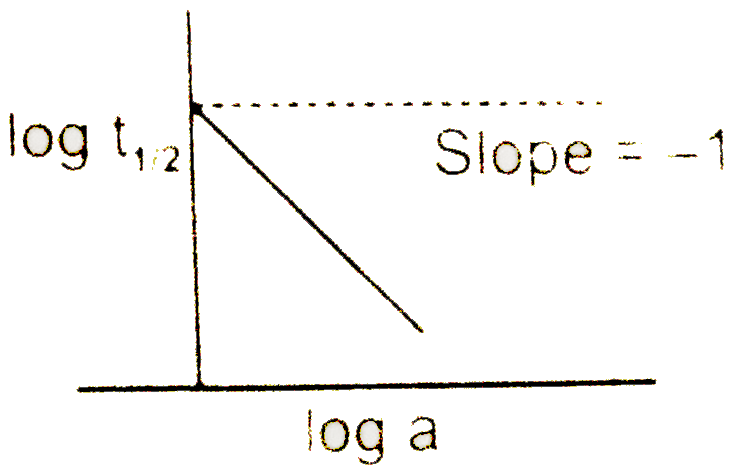
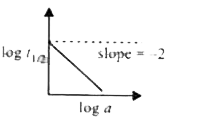
View SolutionA graph between log t1/2 and log a (abscissa), a being the initial concentration of A in the reaction A → product, is depicted in the figure. The rate law is
View Solution

