A particle moves as shown in the following figure 1.104:
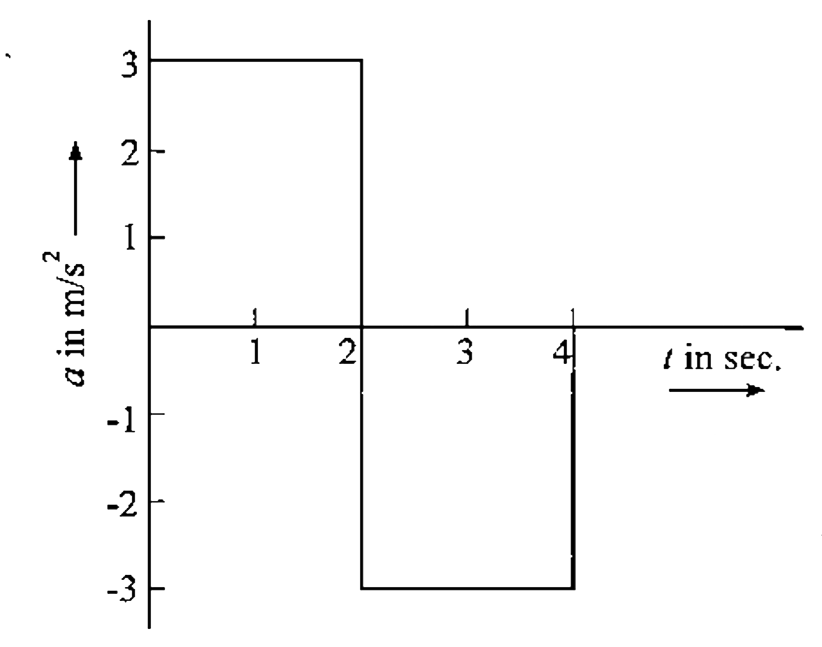
From the above curve the correct velocity-time graph for the interval of 4 seconds will be :
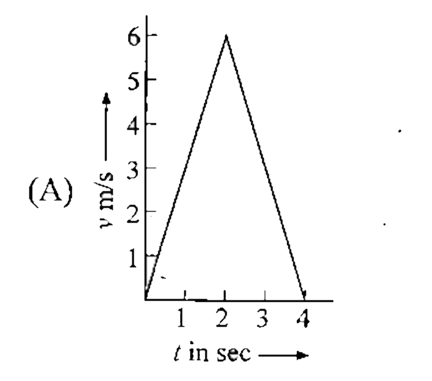
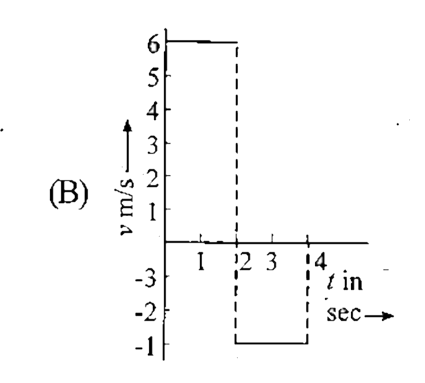
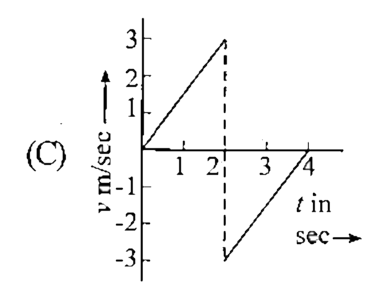
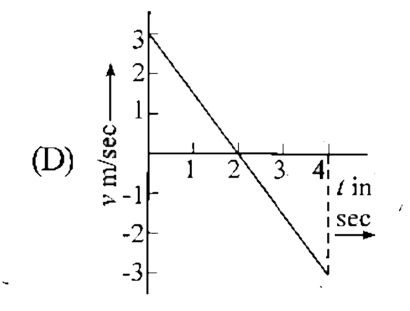
The correct Answer is:A
Step by step video, text & image solution for A particle moves as shown in the following figure 1.104: From the above curve the correct velocity-time graph for the interval of 4 seconds will be : by Physics experts to help you in doubts & scoring excellent marks in Class 11 exams.
Updated on:21/07/2023Topper's Solved these Questions
Similar Questions
The displacement-time graph of a particle executing simple harmonic motion is shown in the figure
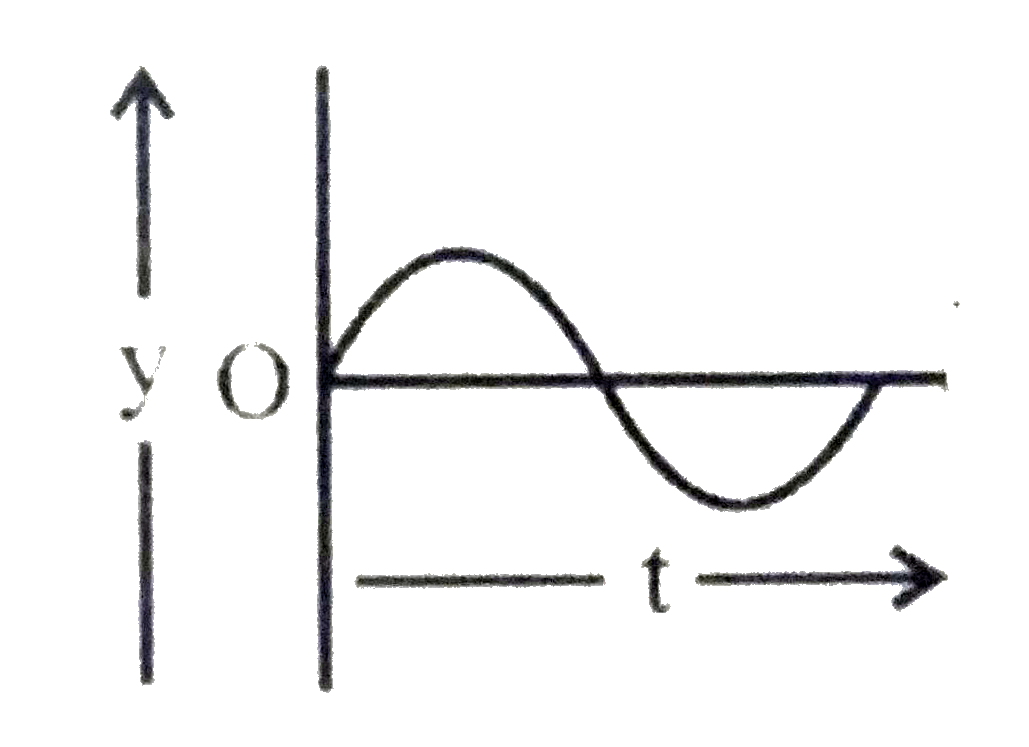
Which one of the following graphs is the correct forcetime graph for the motion of the particle ?
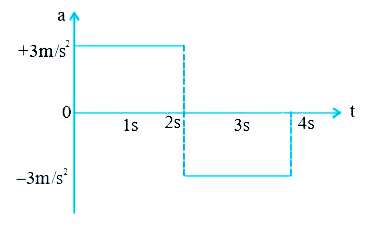
View SolutionA particle starts from rest at t=0 and undergoes an acceleration as shown in figure.
Draw the velocity-time graph of the motion of the particle during the interval from zero to 4 second.
View Solution
Knowledge Check
The velocity − time graph of a particle is as shown in figure
 AIt moves with a constant acceleration throughoutBIt moves with an acceleration of constant magnitude but changing direction at the end of every two secondCThe displacement of the particle is zeroDThe velocity becomes zero at t=4 second
The area under velocity-time graph for a particle in a given interval of time represents
AvelocityBaccelerationCwork doneDDisplacement does not tell the nature of the actual motion of a particle between the points.The force-time(F–t) curve of a particle executing linear motion is as shown in the figure. The momentum acquired by the particle in time interval from zero to 8 second will be
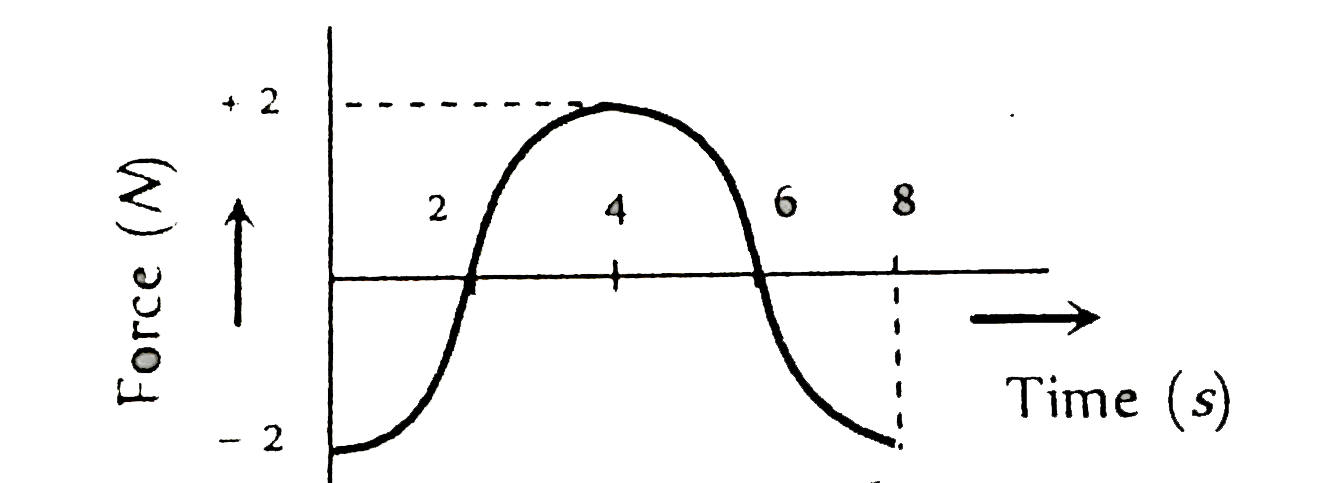 A−2 N-sB+4 N-sC6 N-sDZero
Velocity-time graph of a particle moving in a straight line is shown in figure. Plot the corresponding displacement-time graph of the particle if at time t=0, displacement s=0.
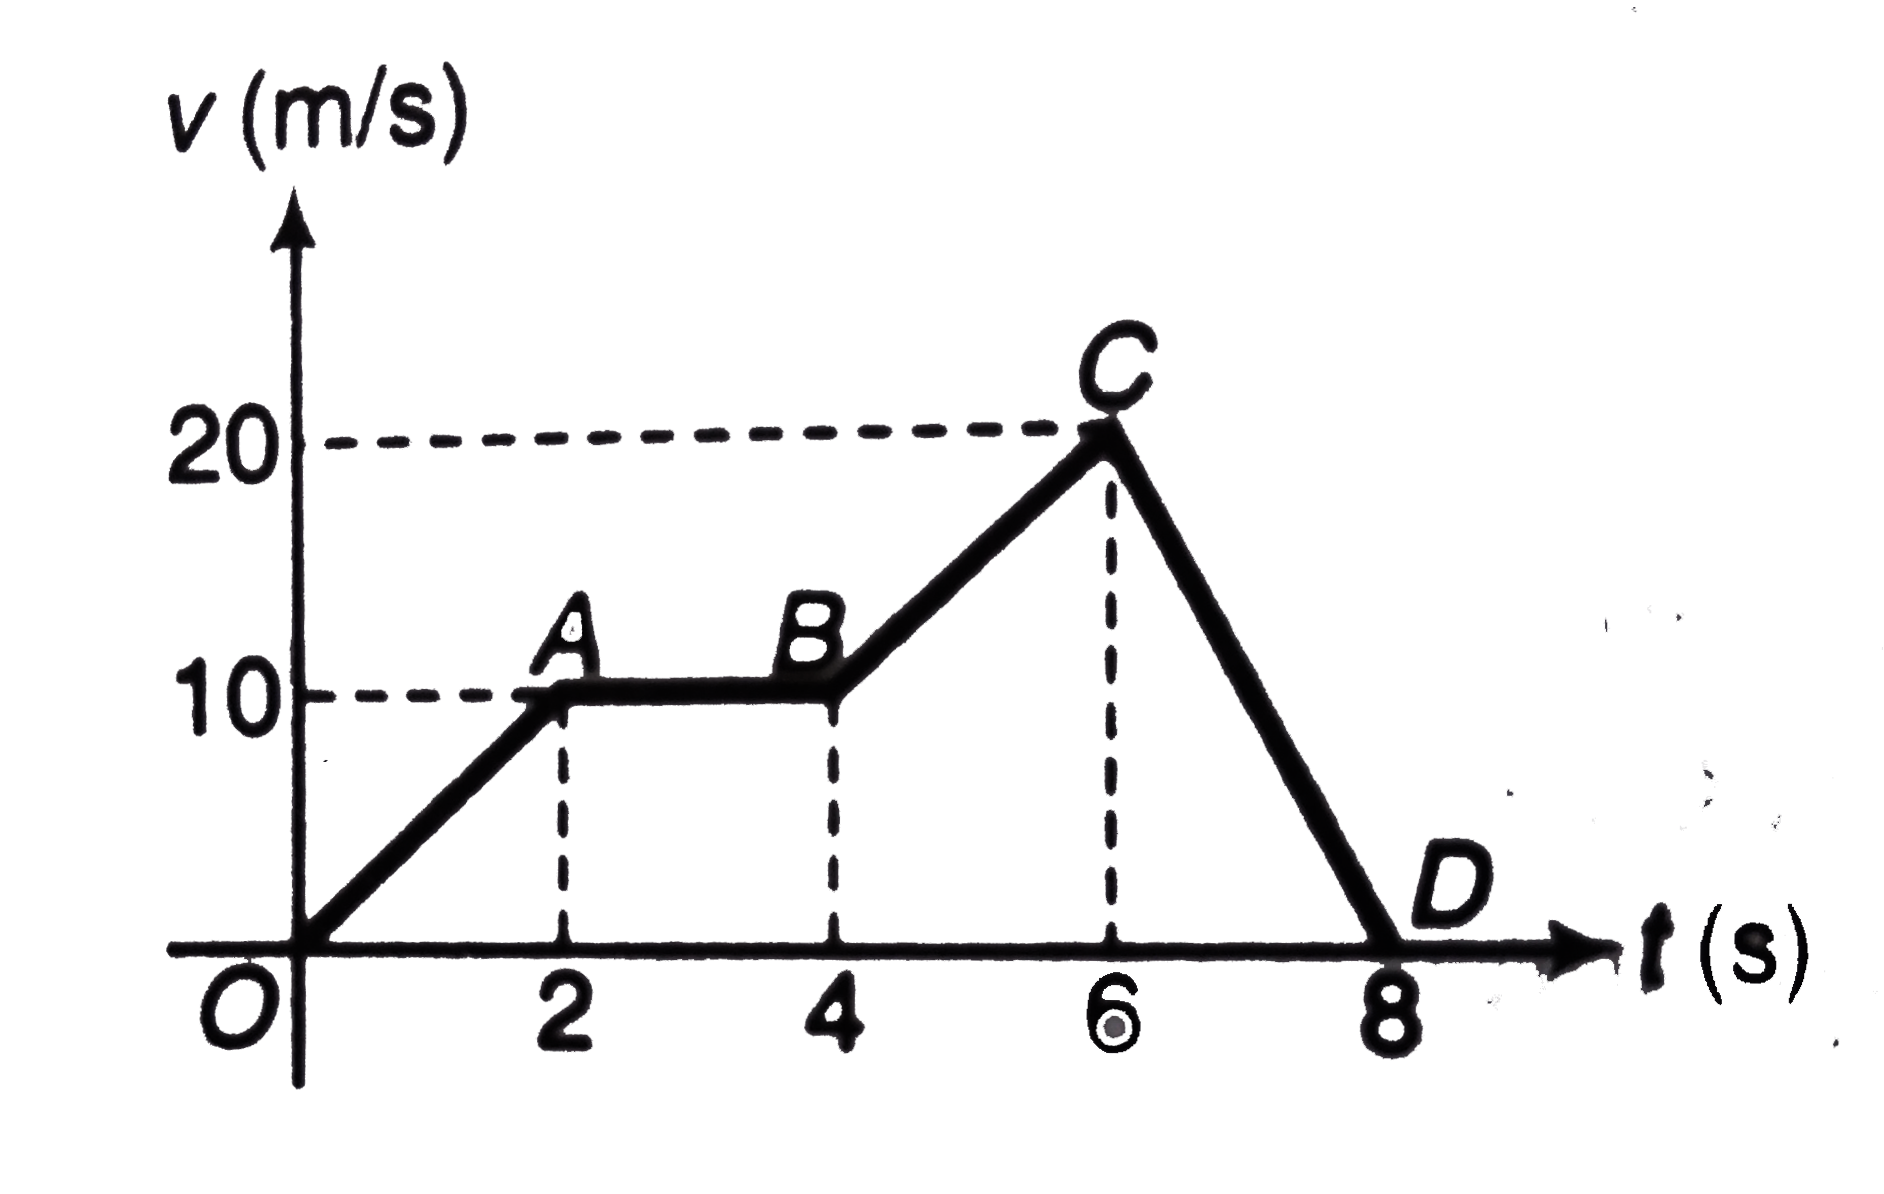
View Solution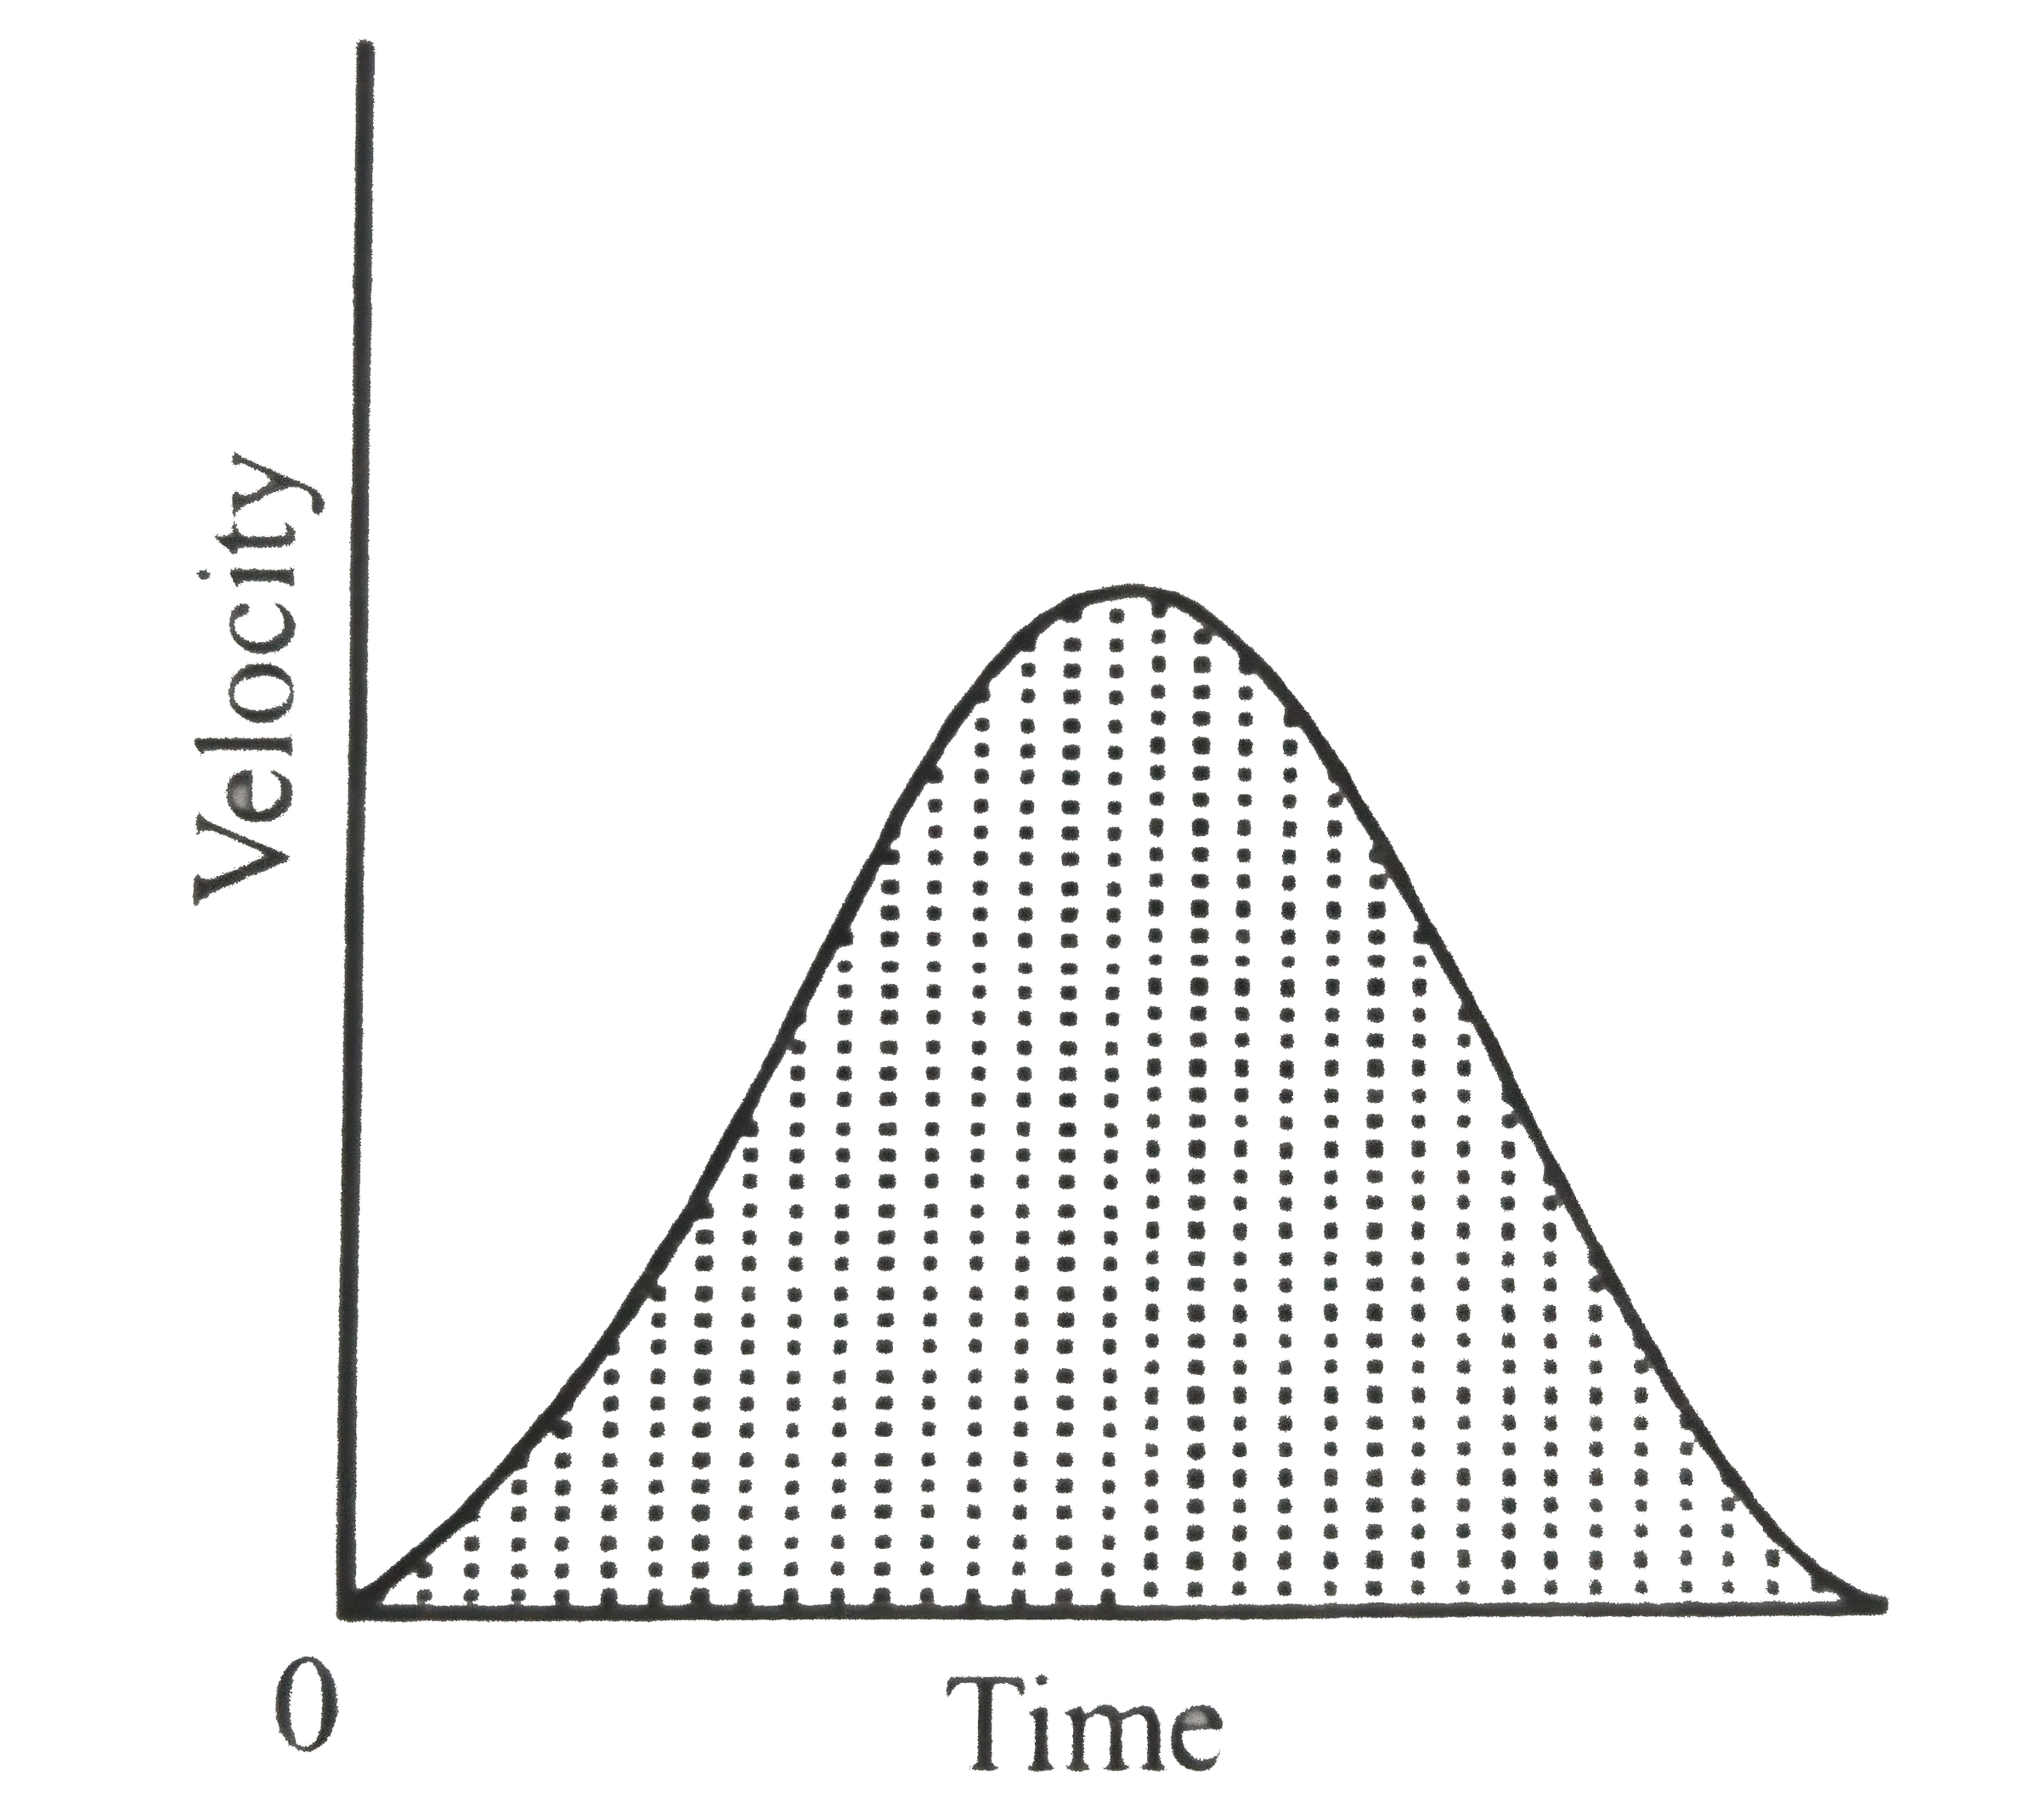
Which one of the following characteristics of the particle does the shaded area of the velocity-time graph shown above represent?
View SolutionThe acceleration-time graph of a particle moving in a straight line is as shown in figure. The velocity of the particle at time t=0 is 2m/s. The velocity after 2 seconds will be
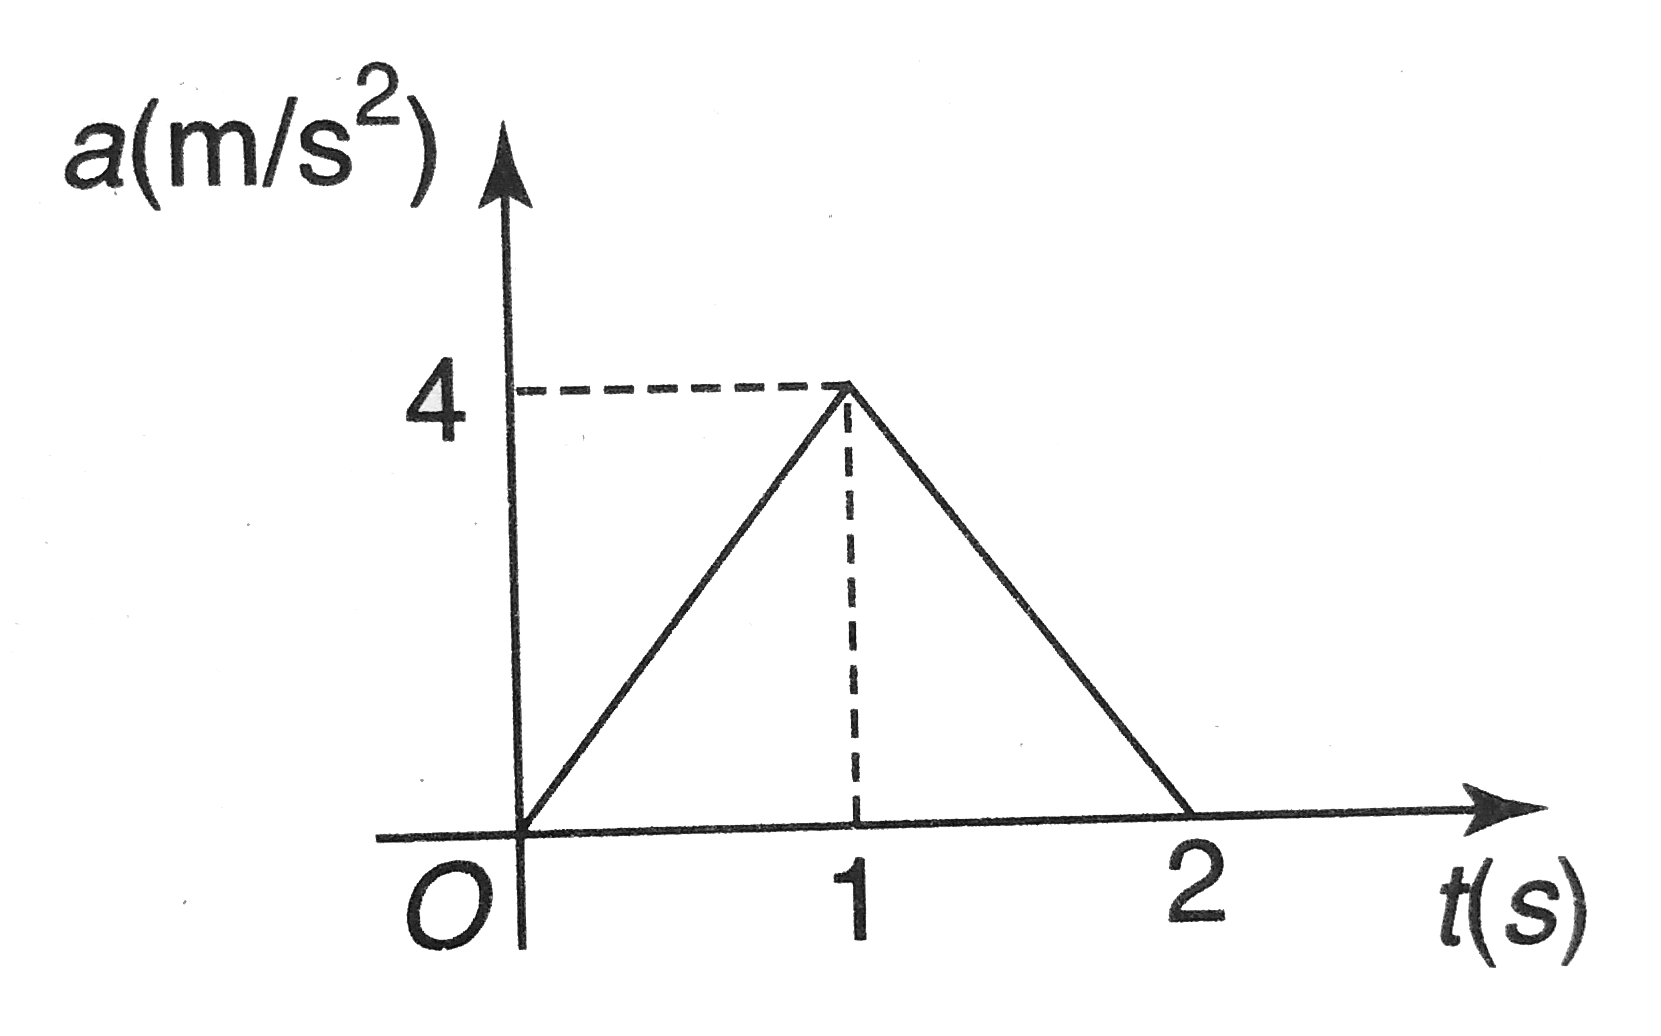
View SolutionThe variation of velocity of a particle with time moving along a straight line is illustrated in the following figure. The distance travelled by the particle in four seconds is.
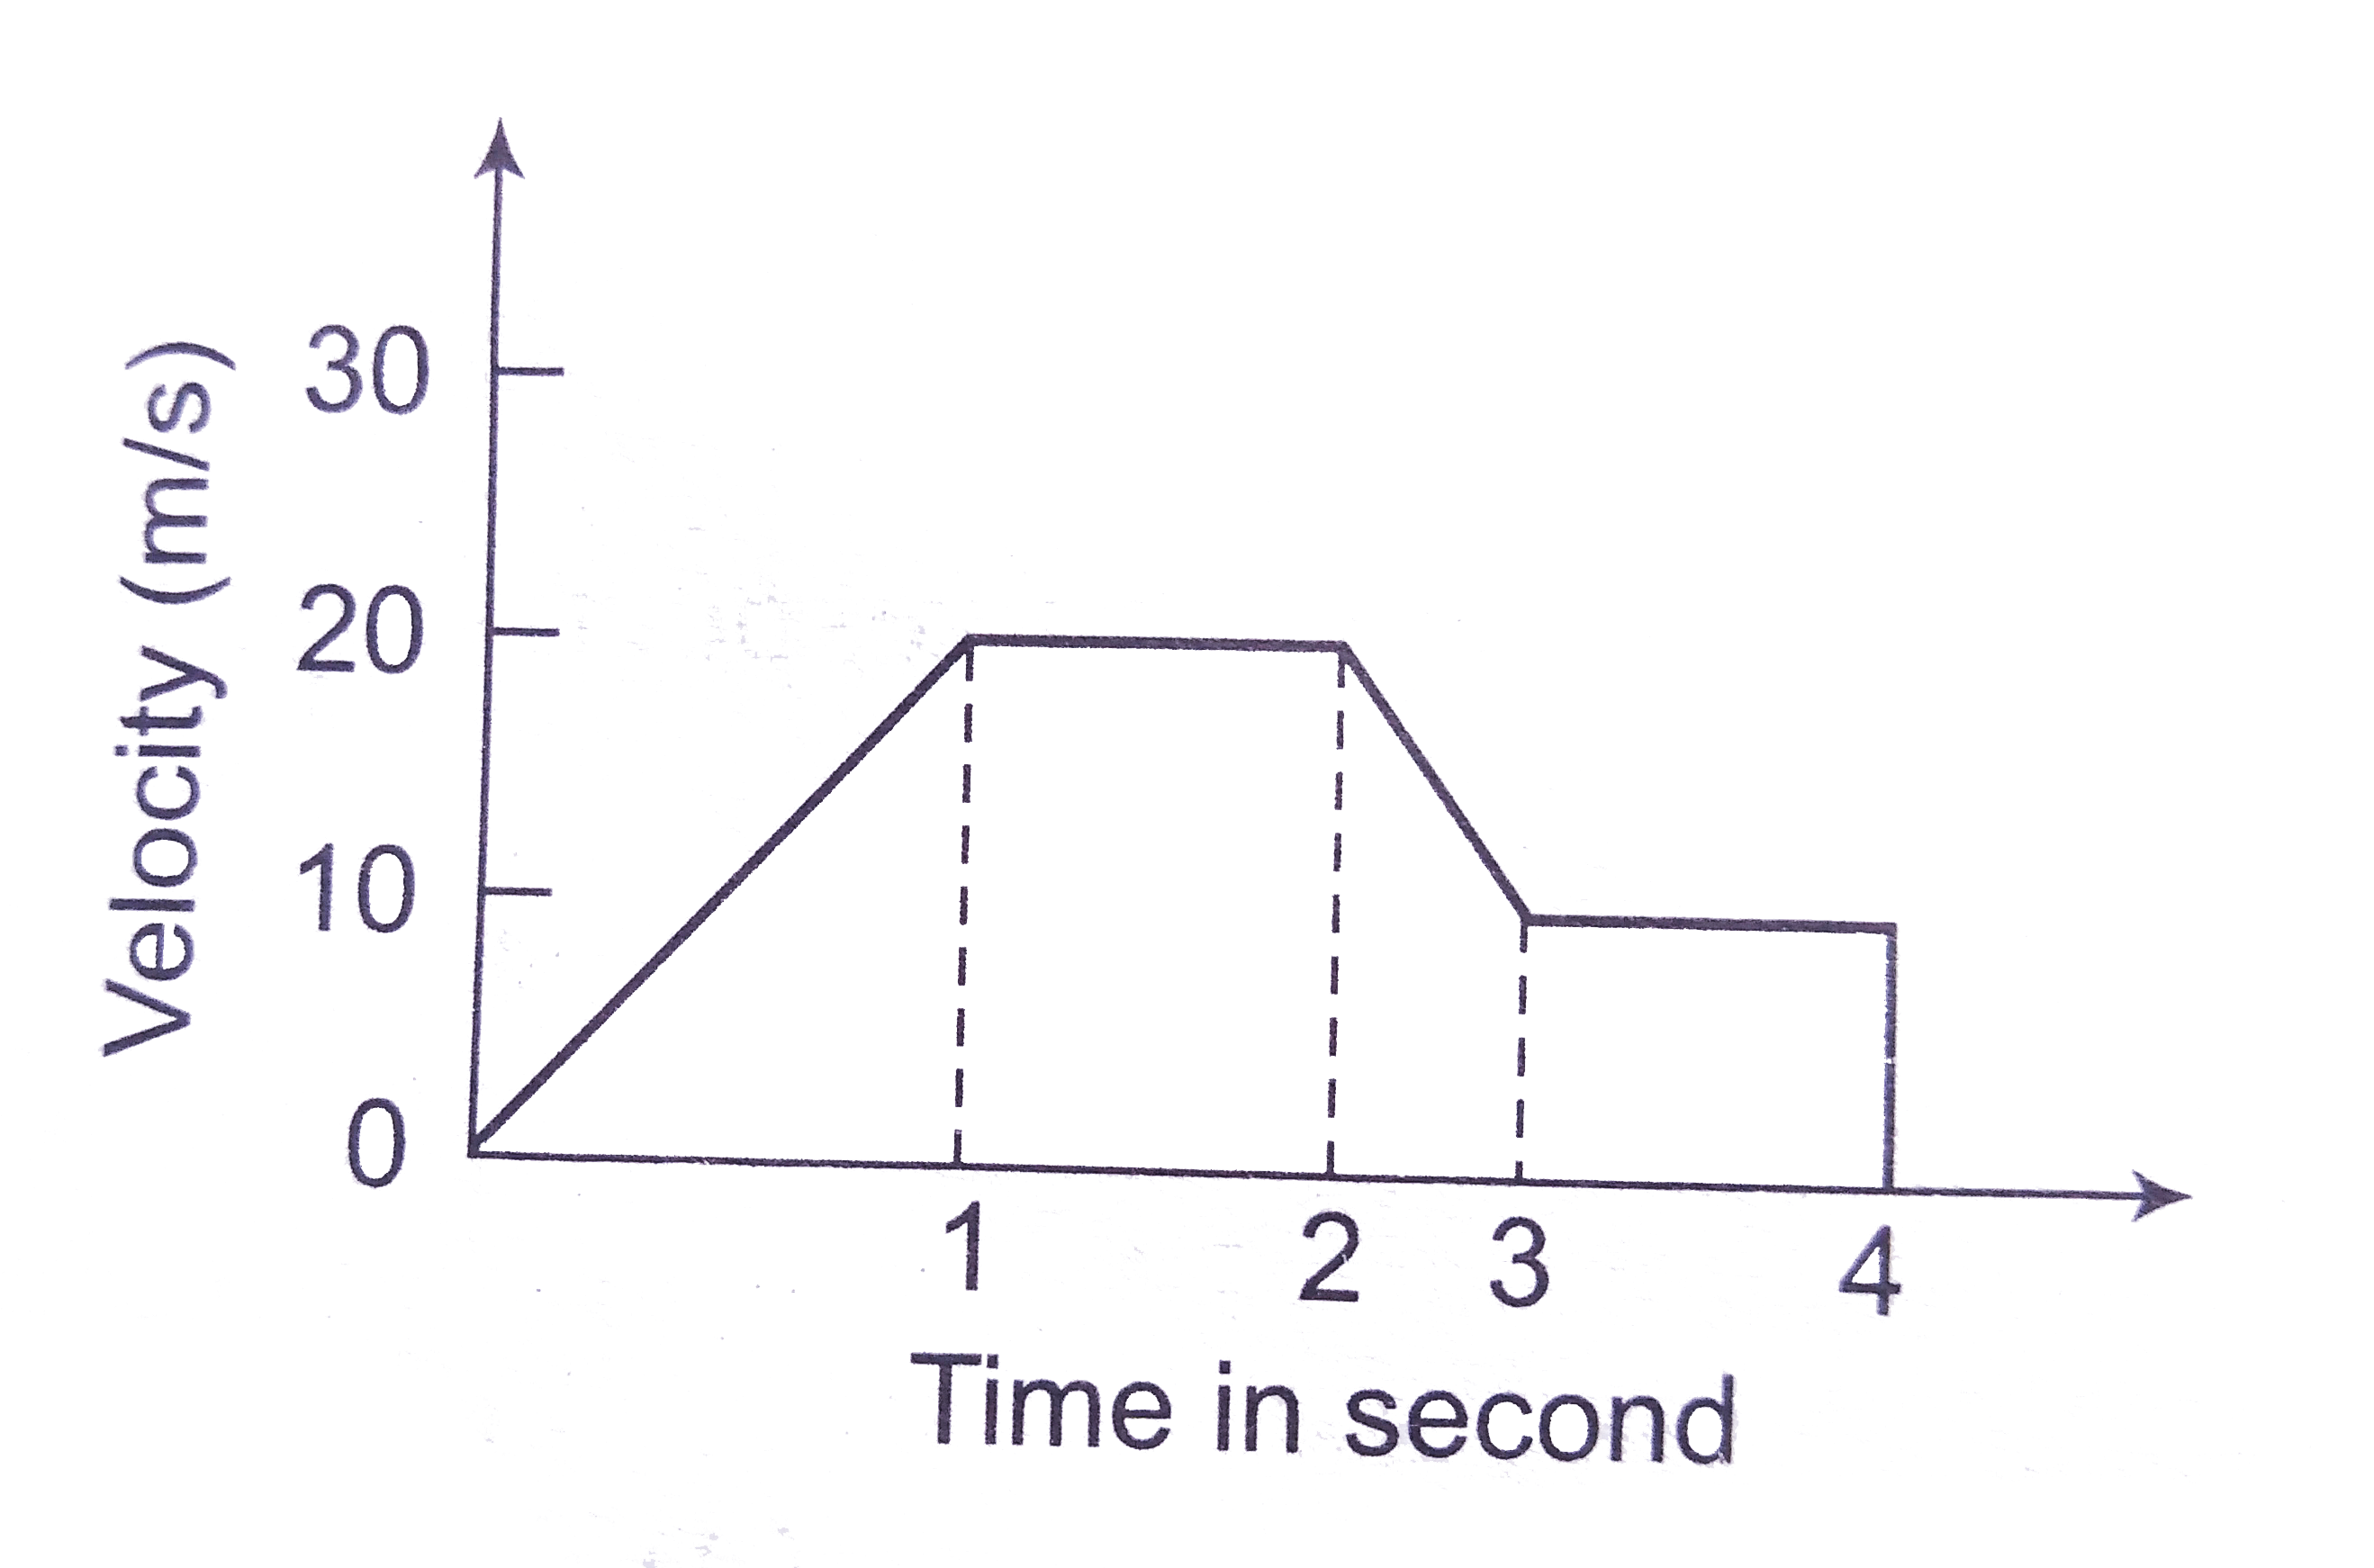
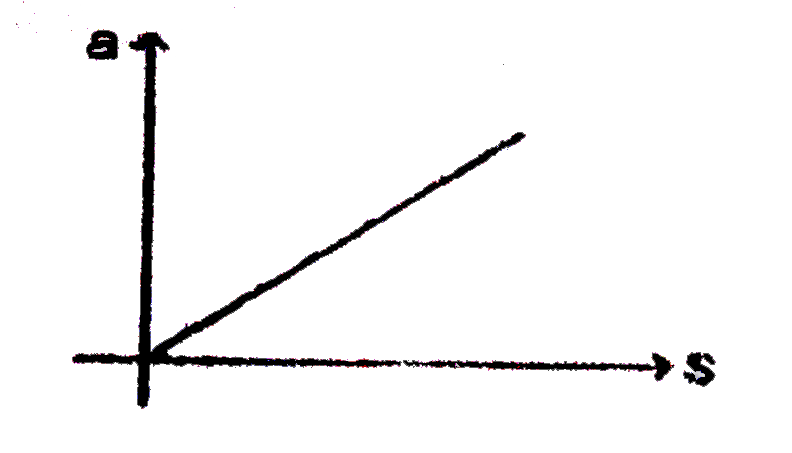
View SolutionAcceleration (a) -displacement (s) graph of a particle moving in a straight line is as shown in the figure. The initial velocity of the particle is zero. The v−s graph of the particle would be
View Solution

