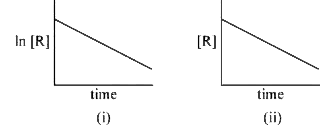
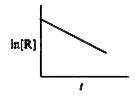
The given plots represent the variation of the concentration of a reactant R with time for different reactions (i) and (ii). The sum of orders of the reactions is ________ .

The correct Answer is:1
axa−xx
For 1st order reaction
+dxdt=k(a−x)1
∫dxa−x=∫kdt
−ln(a−x)=kt+c
If t=0

If t=0
c=−lna∴−ln(a−x)=kt−lna or ln(a−x)=−kt+lna v m x C
Similarly
R(A0)(A)→P
−d[R](A)dt=k[R]0

or −d(R)=kdt or ∫d[R]=−∫kdt
[R]=−kt+c or [A]=−kt+cy=mx+c
Similar Questions
In the reaction of autocatalysis, the variation of concentration with time is correctly represented by which of the following plots?
View SolutionFor chemical reaction R rarr P the variation in the concentration (R ) vs .Time (t) plot given as (i) predict the order of the reaction (ii) what is he slope of the curve?
View SolutionFor a chemical reactin R → P, variation of concentration of R vs time plot is given below : For this reaction :
(i) Predict the order of reaction.
(ii) What is the unit of rate constant (k) ?
View SolutionPlot a graph showing variation in the concentration of reactants against time for a zero order reaction.
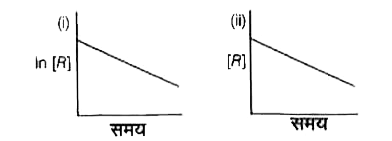
View Solutionनीचे दिए गए प्लॉट, दो अभिक्रियाओं (i) तथा (ii) के लिए, अभिकर्मक R की सान्द्रता का समय के साथ होने वाले परिवर्तन को निरूपित करते हैं। अभिक्रियाओं की क्रमिक कोटि हैं

View SolutionFor a given reaction the logarithm of the concentration of the reactant plotted against time gave a straight line with negative slope . The order of the reaction is
View SolutionThe given plots represent the variation of the concentration of a reactant R with time for different reactions (i) and (ii). The sum of orders of the reactions is ________ .
View SolutionThe given plots represent the variation of the concentration of a reactant R with time for different reactions (i) and (ii). The respective orders of the reactions are:
View Solution
