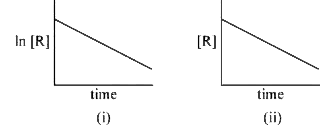
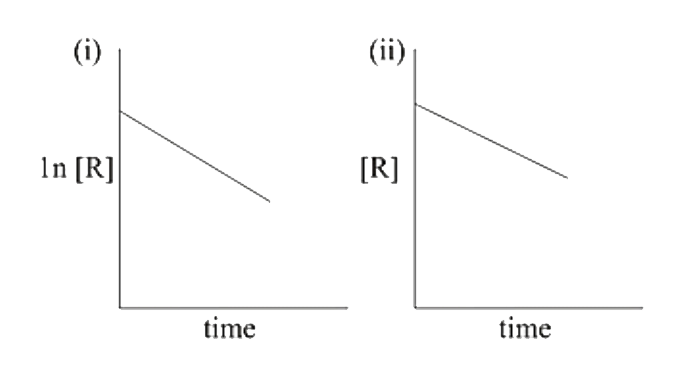
The given plots represent the variation of the concentration of a reactant R with time for different reactions (i) and (ii). The sum of orders of the reactions is ________ .

The correct Answer is:1
axa−xx
For 1st order reaction
+dxdt=k(a−x)1
∫dxa−x=∫kdt
−ln(a−x)=kt+c
If t=0

If t=0
c=−lna∴−ln(a−x)=kt−lna or ln(a−x)=−kt+lna v m x C
Similarly
R(A0)(A)→P
−d[R](A)dt=k[R]0

or −d(R)=kdt or ∫d[R]=−∫kdt
[R]=−kt+c or [A]=−kt+cy=mx+c
Topper's Solved these Questions
Similar Questions
For the reaction 2A+B→C, the values of initial rate at different reactant concentrations are given in the table below. The over all order of reaction is __________.

View SolutionThe sum of number of stereo centers present in linear and cyclic structures of glucose is _________ .
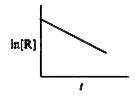
View SolutionFor chemical reaction R rarr P the variation in the concentration (R ) vs .Time (t) plot given as (i) predict the order of the reaction (ii) what is he slope of the curve?
View SolutionFor a chemical reactin R → P, variation of concentration of R vs time plot is given below : For this reaction :
(i) Predict the order of reaction.
(ii) What is the unit of rate constant (k) ?
View SolutionThe given plots represent the variation of the concentration of a reactant R with time for different reactions (i) and (ii). The sum of orders of the reactions is ________ .
View SolutionThe given plots represent the variation of the concentration of a reactant R with time for different reactions (i) and (ii). The respective orders of the reactions are:
View SolutionThe given plots represent the variation of the concentration of a reactant R with time for two different reaction (i) and (ii) The respective orders of the reactions are

View SolutionFor a chemical reaction R to P, the variation in the concentration (R) vs time (t) plot is given : Predict the order of reaction.
View SolutionThe given plots represent the variation of the concentration of a reactant R with time for two different reaction (i) and (ii) The respective orders of the reactions are

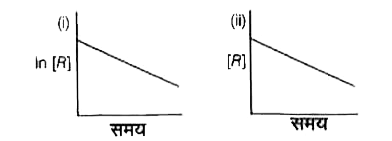
View Solutionनीचे दिए गए प्लॉट, दो अभिक्रियाओं (i) तथा (ii) के लिए, अभिकर्मक R की सान्द्रता का समय के साथ होने वाले परिवर्तन को निरूपित करते हैं। अभिक्रियाओं की क्रमिक कोटि हैं

View SolutionIn the reaction of autocatalysis, the variation of concentration with time is correctly represented by which of the following plots?
View SolutionFor chemical reaction R rarr P the variation in the concentration (R ) vs .Time (t) plot given as (i) predict the order of the reaction (ii) what is he slope of the curve?
View SolutionFor a chemical reactin R → P, variation of concentration of R vs time plot is given below : For this reaction :
(i) Predict the order of reaction.
(ii) What is the unit of rate constant (k) ?
View SolutionPlot a graph showing variation in the concentration of reactants against time for a zero order reaction.
View Solutionनीचे दिए गए प्लॉट, दो अभिक्रियाओं (i) तथा (ii) के लिए, अभिकर्मक R की सान्द्रता का समय के साथ होने वाले परिवर्तन को निरूपित करते हैं। अभिक्रियाओं की क्रमिक कोटि हैं

View Solution

