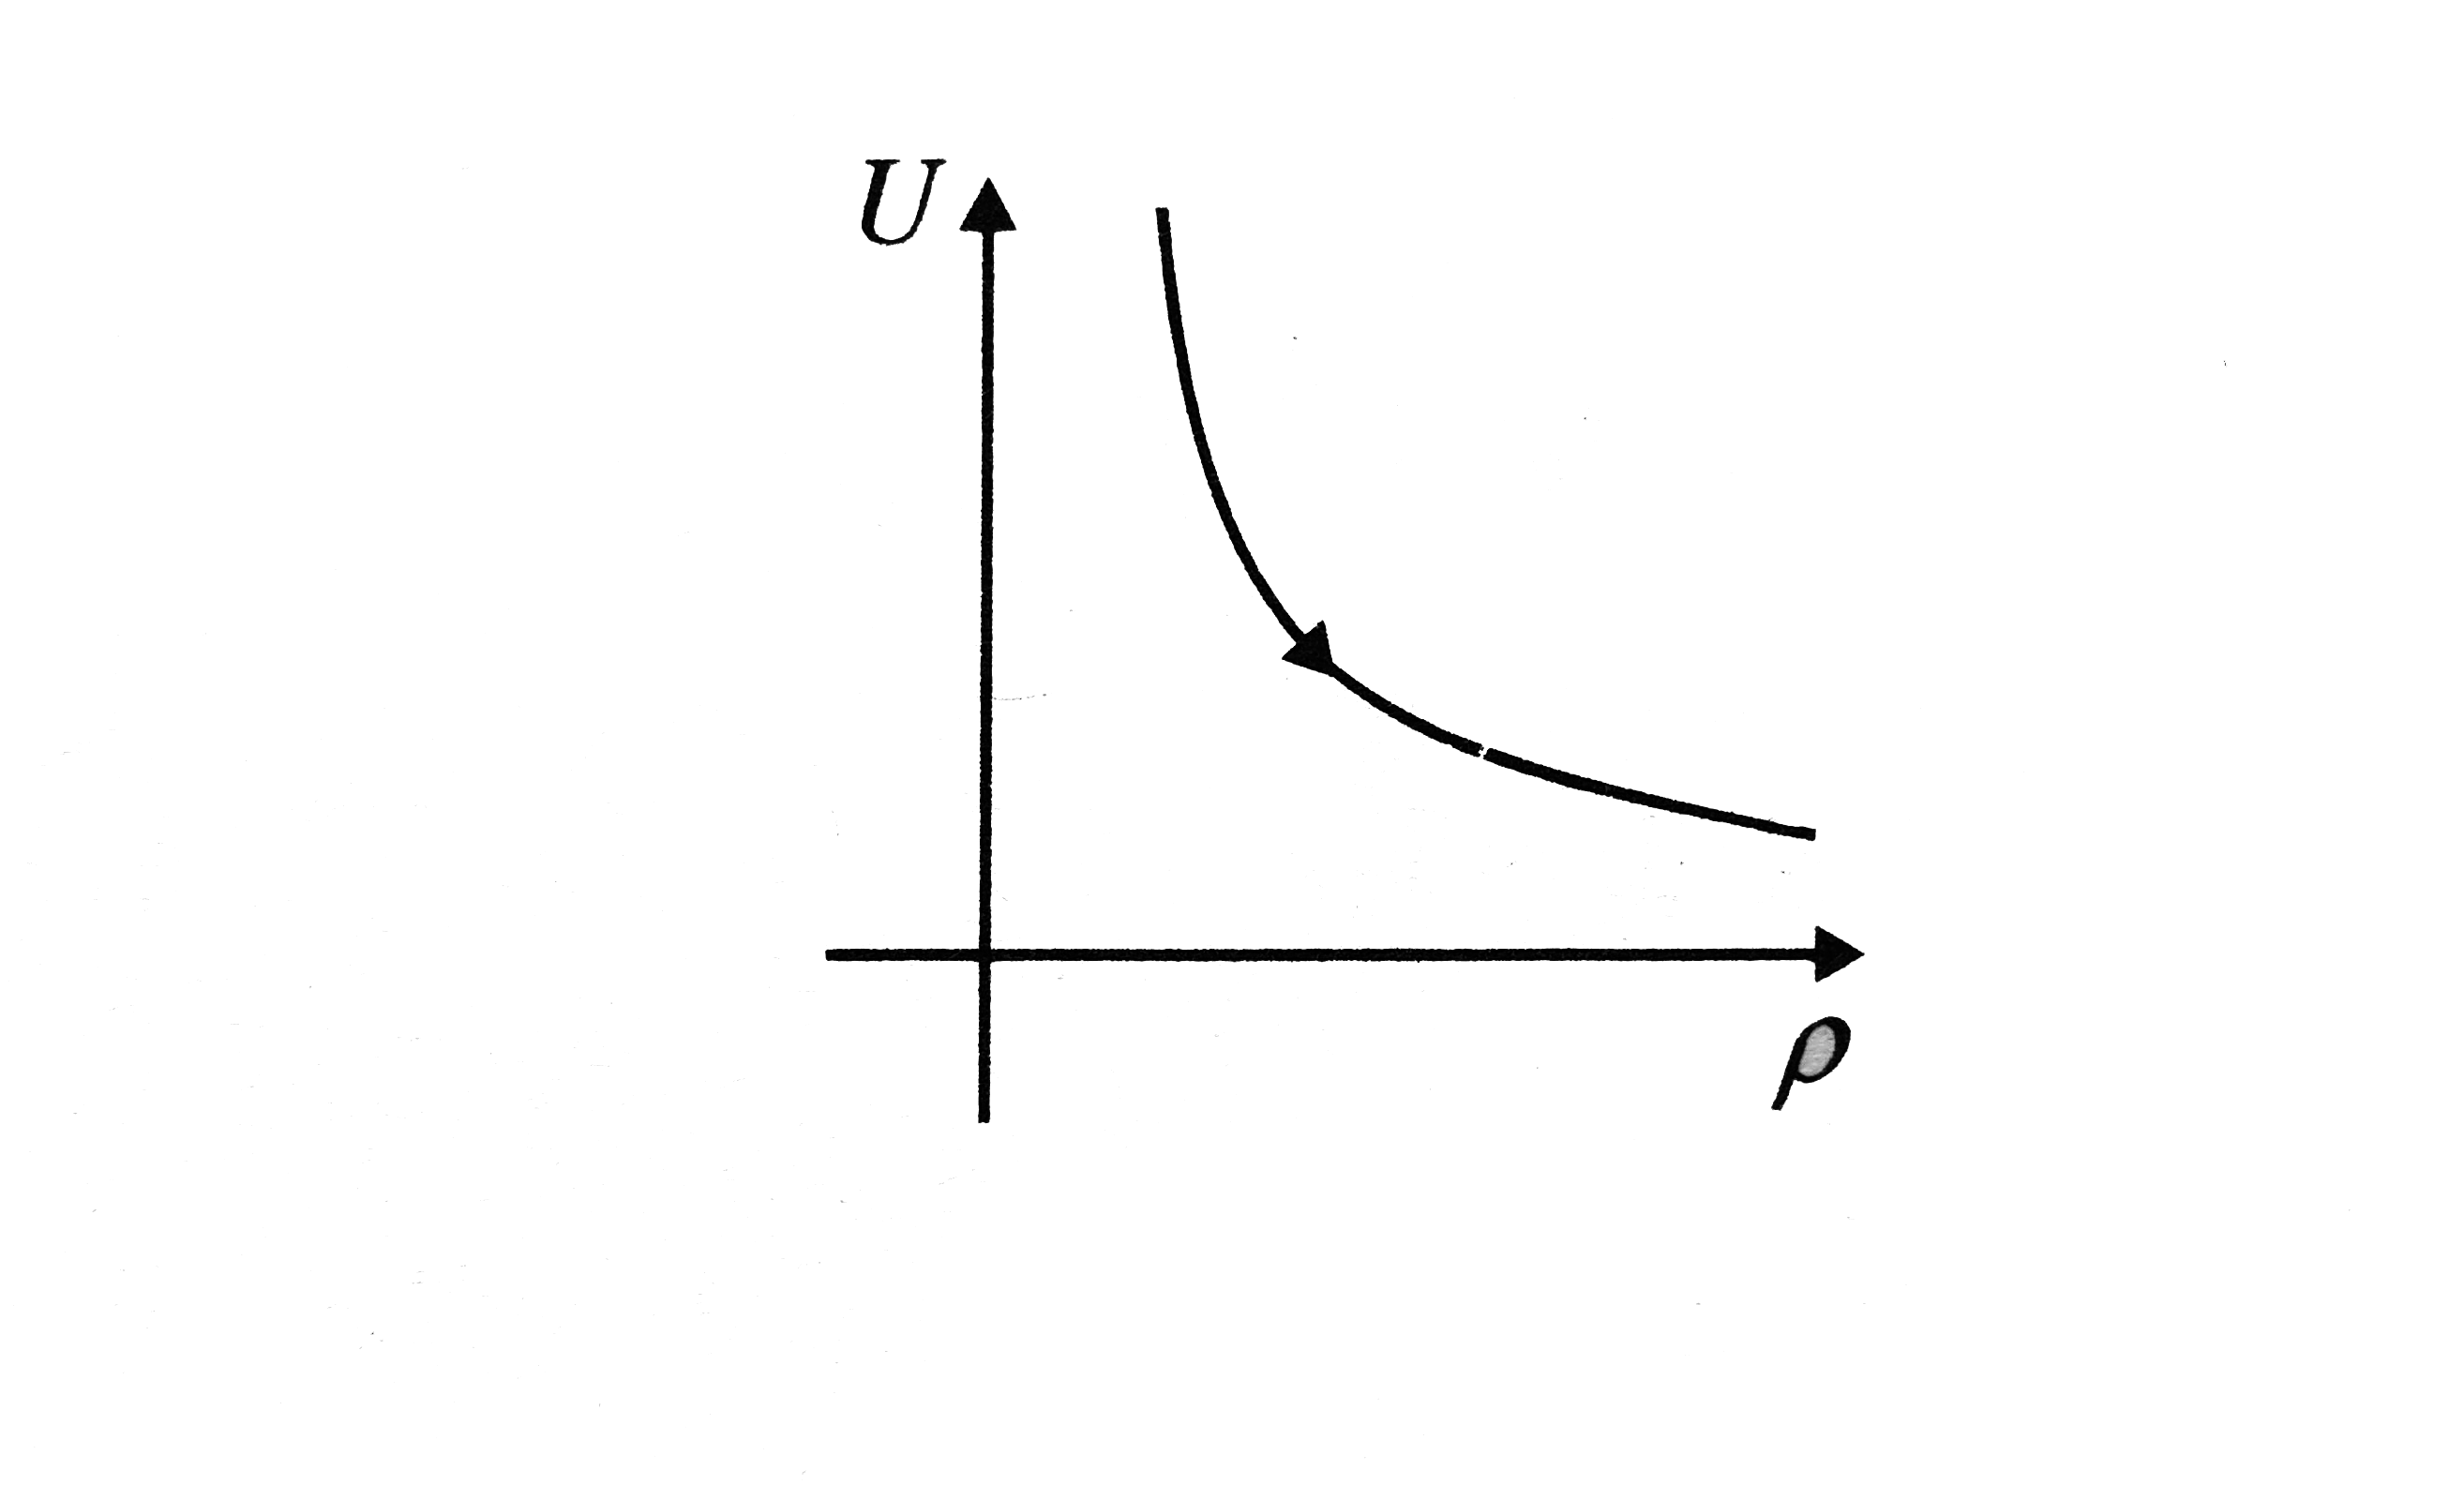
Variation of internal energy with density of 1mole of monatomic gas is depicted in Fig. Corresponding variation of pressure with voluem can be depicted as (assume the curve is rectangular hyperbola)
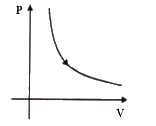
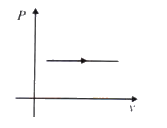
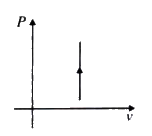
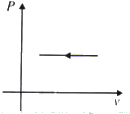
The correct Answer is:D
Step by step video & image solution for Variation of internal energy with density of 1 "mole" of monatomic gas is depicted in Fig. Corresponding variation of pressure with voluem can be depicted as (assume the curve is rectangular hyperbola) by Physics experts to help you in doubts & scoring excellent marks in Class 12 exams.
Updated on:21/07/2023Similar Questions
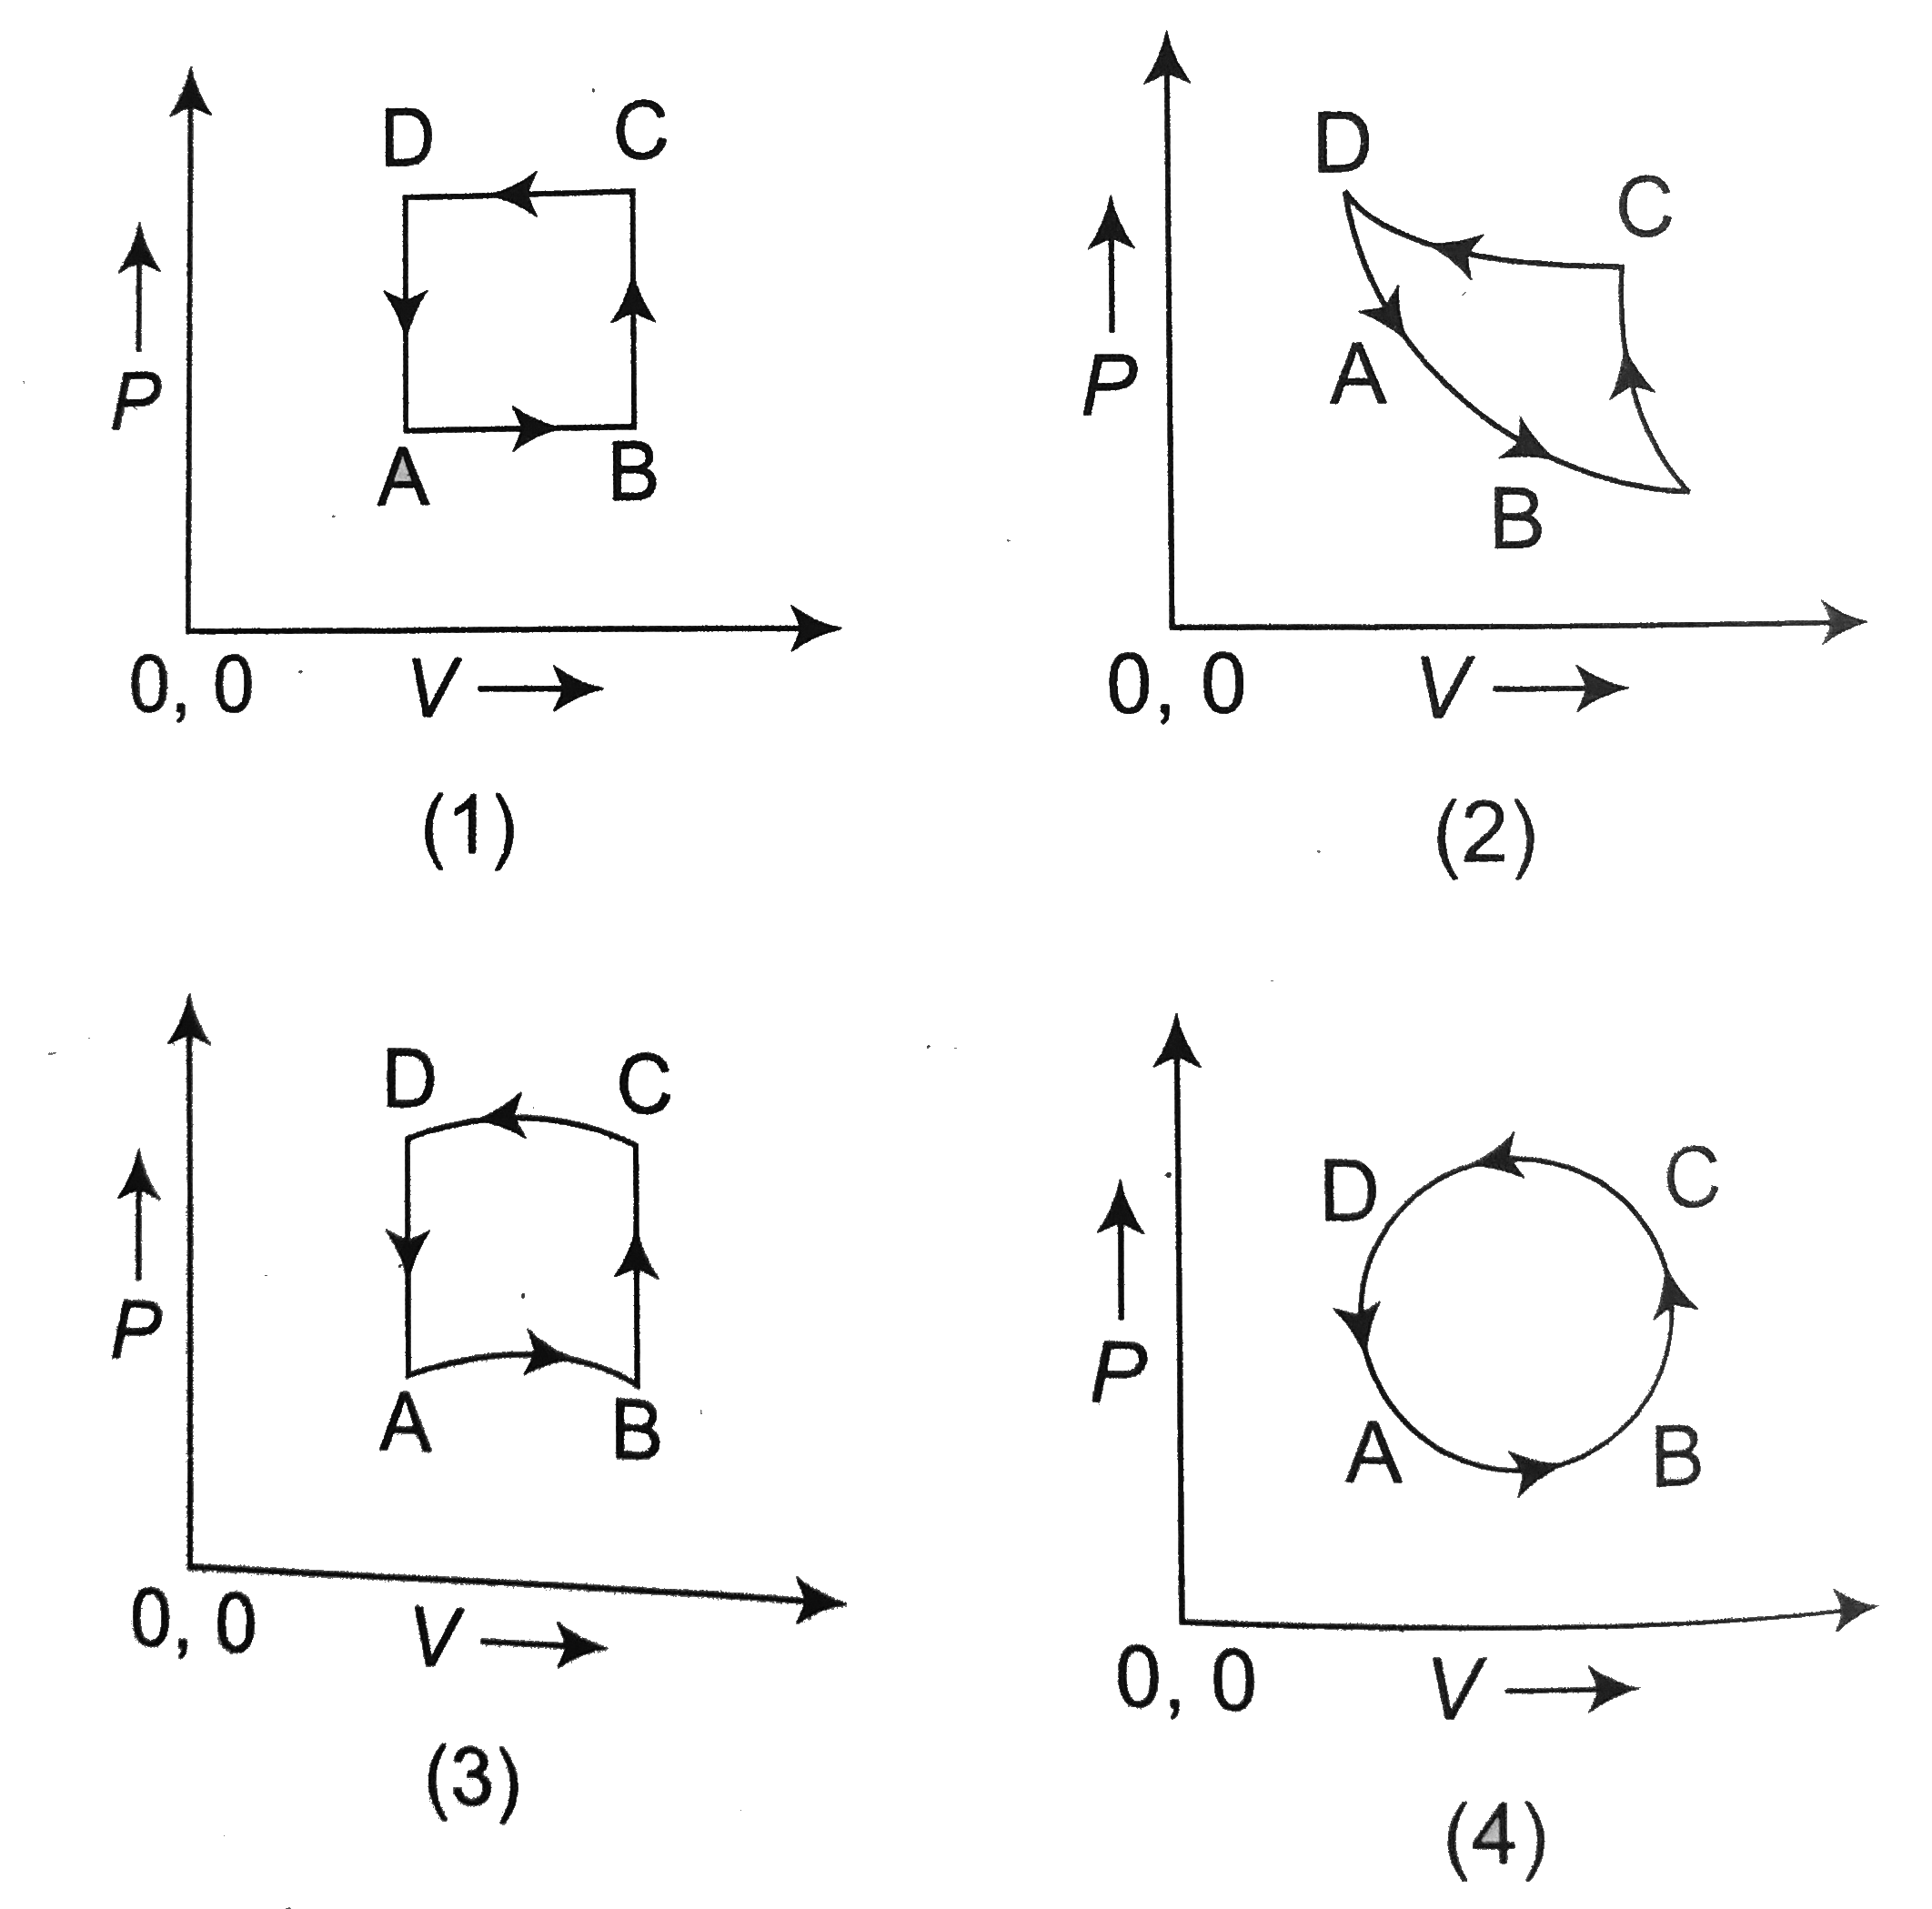
Choose the correct option: In following figs. Variation of volume by change of pressure is shown in Fig. A gas is taken along the path ABCDA . The change in internal energy of the the gas will be:
View SolutionVariation of internal energy with density of 1 "mole" of monatomic gas is depicted in Fig. Corresponding variation of pressure with voluem can be depicted as (assume the curve is rectangular hyperbola)
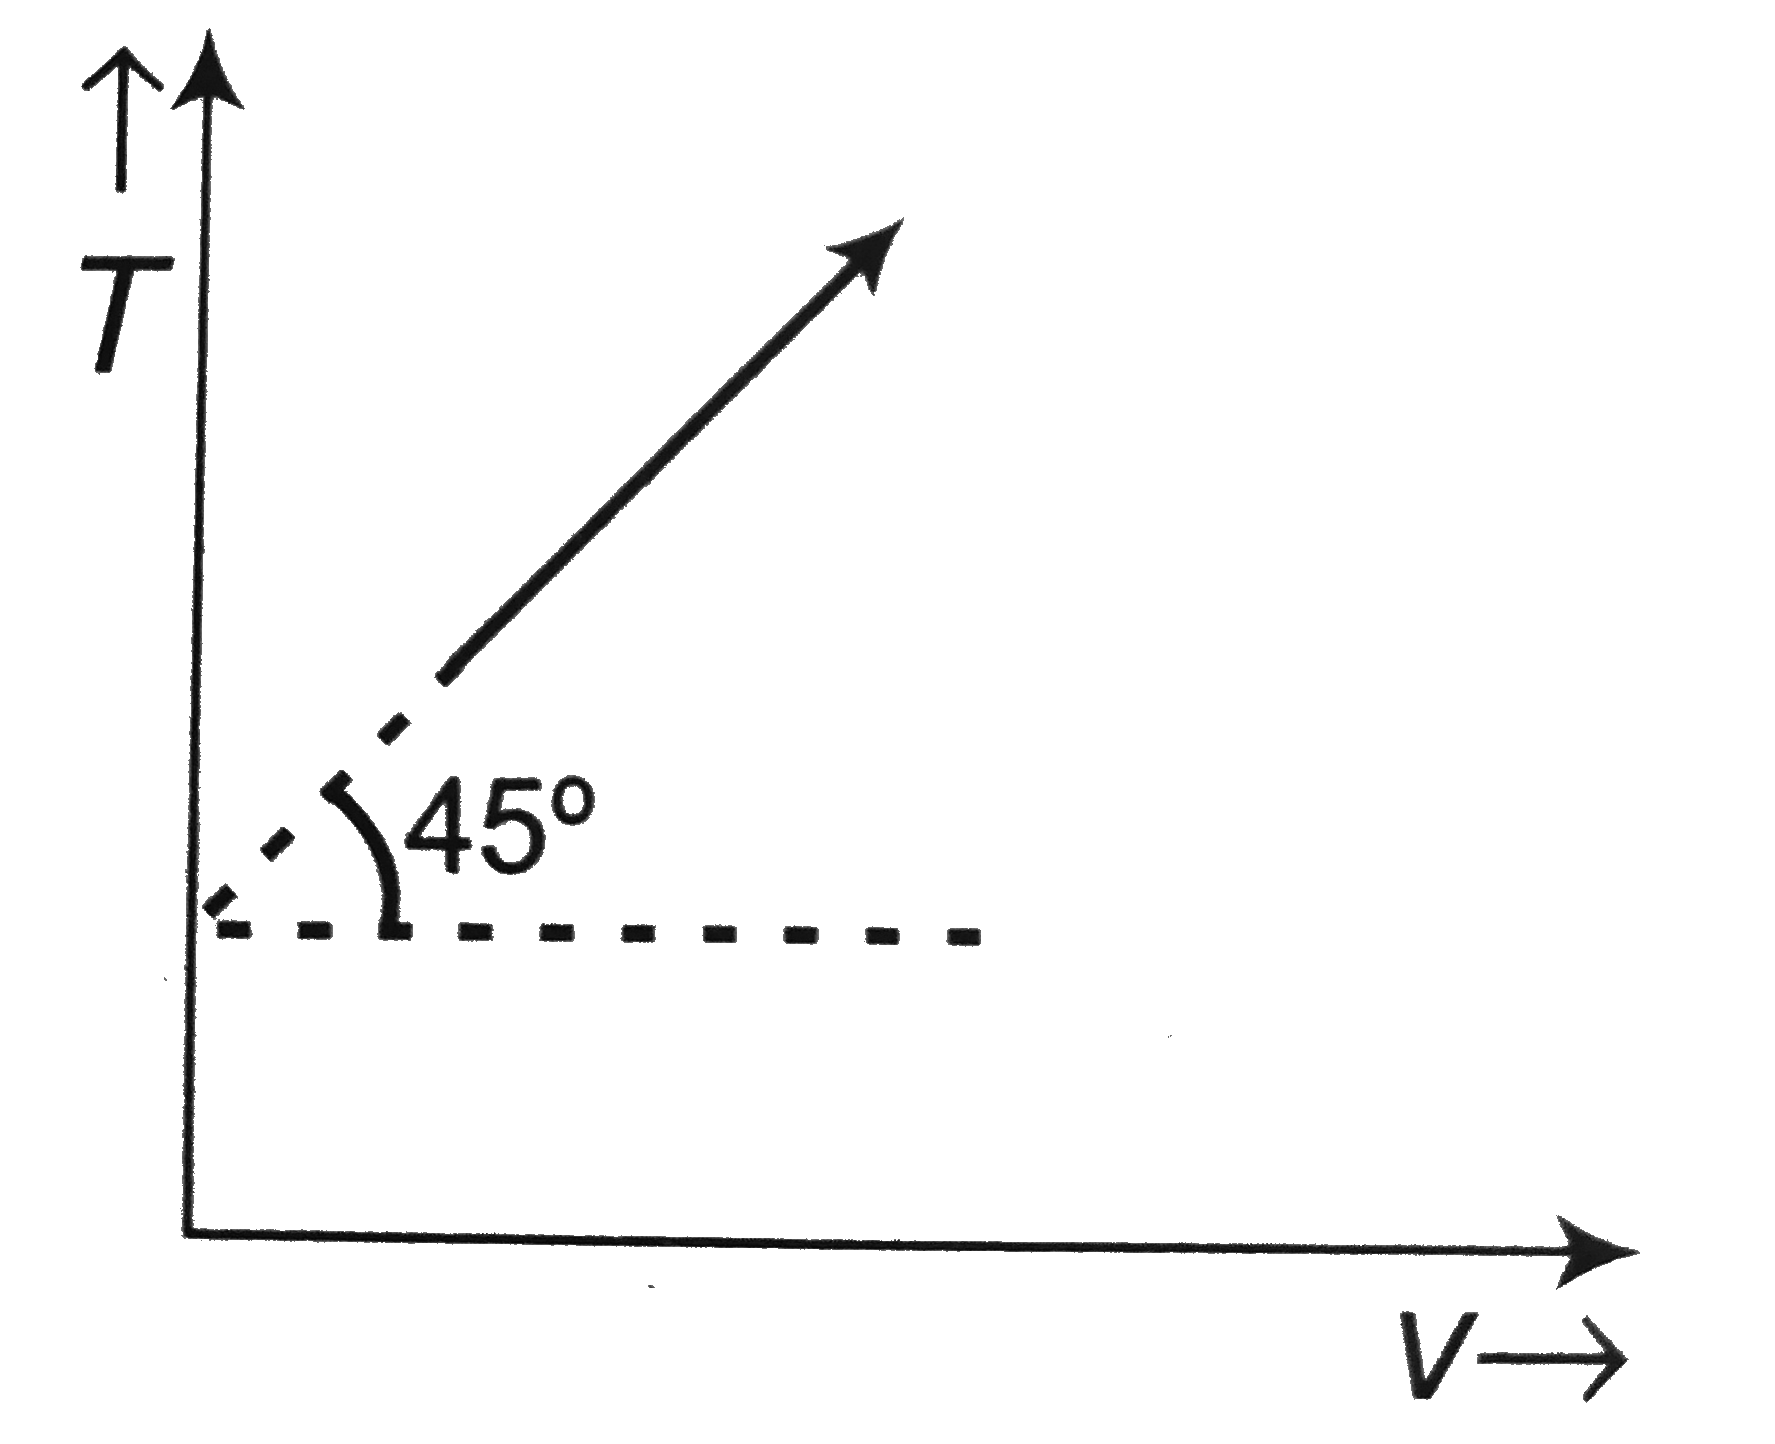
View SolutionThe given curve represents the variation of temperature as a function of volume for one mole of an ideal gas. Which of the following curves best represents the variation of pressure as a function of volume?
View SolutionThe graph shows variation of internal energy U with density ρ of one mole of an ideal monatomic gas. The process AB is a part of rectangular hyperbola. Find the work done (in J ) in the process.
'(##CEN_KSR_PHY_JEE_C15_E01_024_Q14##)'
View SolutionIn following figs. Variation of volume by change of pressure is shown in Fig. A gas is taken along the path ABCDA. The change in internal energy of the tgas will be:
View SolutionThe given curve represents the variation of temperatue as a function of volume for one mole of an ideal gas. Which of the following curves best represents the variation of pressure as a function of volume ? .
View Solution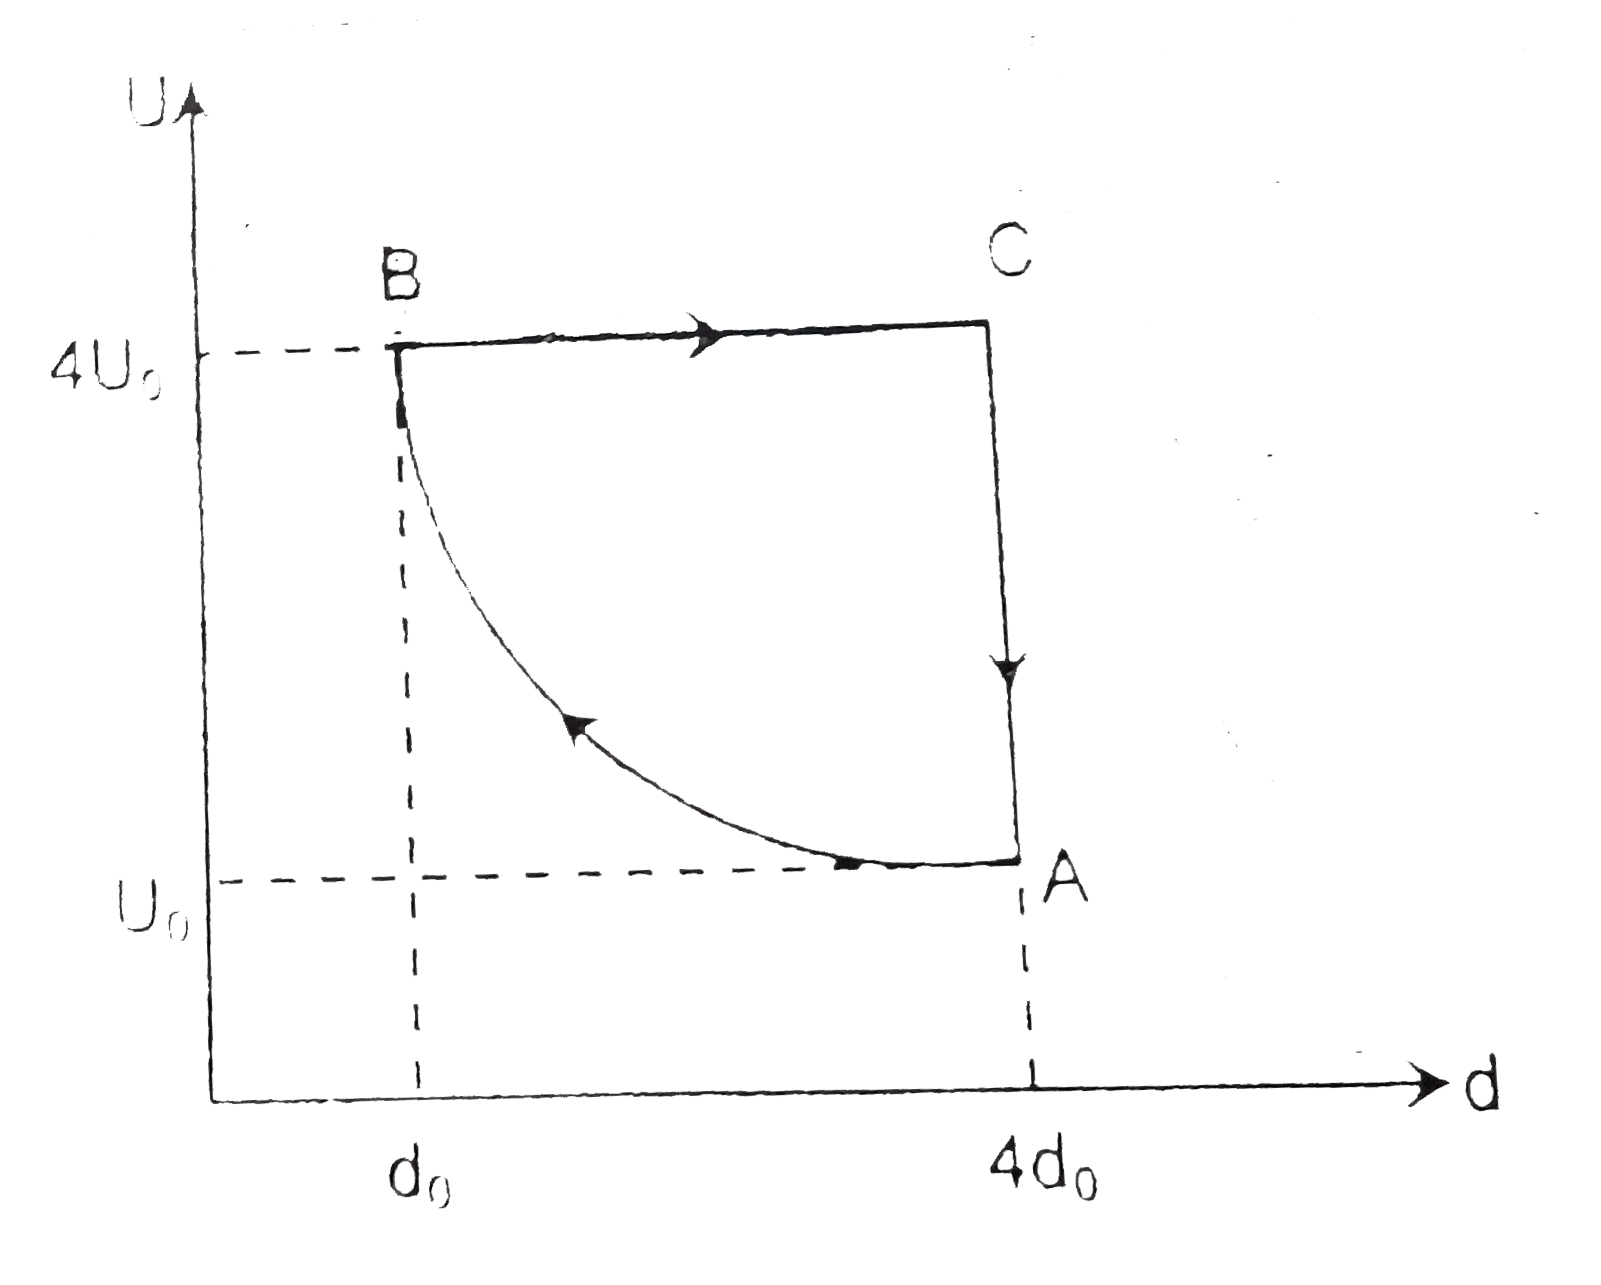
The variation of internal energy U and density d of one mole of an ideal monatomic gas is shown inn cyclic process ABCA. The curve from A to B is a rectangular hyperbola. Select correct alternatives.
View SolutionThe given curve represents the variation of temperature as a function of volume for one mole of an ideal gas. Which of the following curves best represents the variation of pressure as a function of volume?
View Solution
