For a simple pendulum the graph between length and time period will be a……………Solution in Tamil
hyperbola
Parabola
Straight line
none of these
The correct Answer is:B
T=2π√lgorT2=(4π2g)l
This shows that the graph between T and L will be a Parabola.
Similar Questions
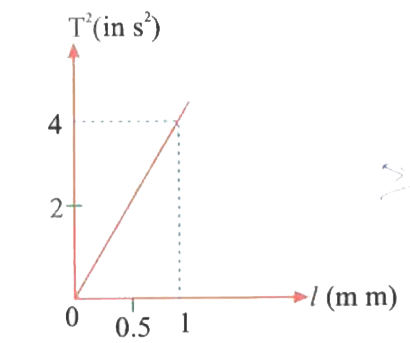
The l−T2 graph of a simple pendulum is an shown in the figure. The time period of the pendulum of length 0.5 mm is

View SolutionIf the time period of a simple pendulum of effective length L is T, then the effective length of a simple pendulum having time period 2T will be
View SolutionThe graph of time period (T) of simple pendulum versus its length (l) is
View Solutionसरल लोलक की लम्बाई तथा उसके आवर्तकाल के बीच सही ग्राफ है
View SolutionThe graph of time period (T) of a simple pendulum versus its length (I) is
View SolutionIf the length of a simple pendulum is increased by 2%, then the time period
View SolutionA student is advised to study the variation of period of oscillation with the length of a simple pendulum in the laboratory. Accordingly he recorded the period of oscillation for different lengths of the pendulum. If he plots a graph between the length and period of oscillation ,what will be the shape of the graph?
View Solution
