The following pie chart shows the hourly distribution of all the major activities of a student.
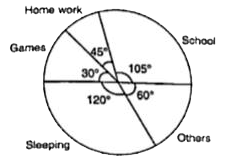
The percentage of time which he spends in school is :
38%
30%
40%
25%
The correct Answer is:B
Step by step video, text & image solution for The following pie chart shows the hourly distribution of all the major activities of a student. The percentage of time which he spends in school is : by Maths experts to help you in doubts & scoring excellent marks in Class 14 exams.
Updated on:21/07/2023Topper's Solved these Questions
- PERCENTAGESBOOK - ARIHANT SSCCHAPTER - PERCENTAGESEXERCISE - Exercise (Level - 2)
50 Videos
- PERCENTAGEBOOK - ARIHANT SSCCHAPTER - PERCENTAGEEXERCISE - Higher Skill Level Questions
27 Videos
- PERMUTATIONS & COMBINATIONS BOOK - ARIHANT SSCCHAPTER - PERMUTATIONS & COMBINATIONS EXERCISE - FINAL ROUND
38 Videos
Similar Questions
The following pie-chart shows the percentage-wise distribution of the number of students in five different schools P, Q, R, S and T. The total number of students in all five schools together is 8400.
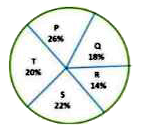
Find the average number of students in schools R and S together.
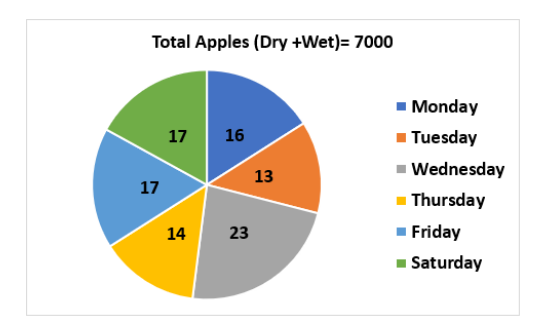
View SolutionDirection: Study the following information carefully and answer the given questions: The following pie chart shows the percentage distribution of total number of Apples (Wet +dry)
The pie chart2 shows the percentage distribution of total number of Apples (Wet) sold in different days of a week.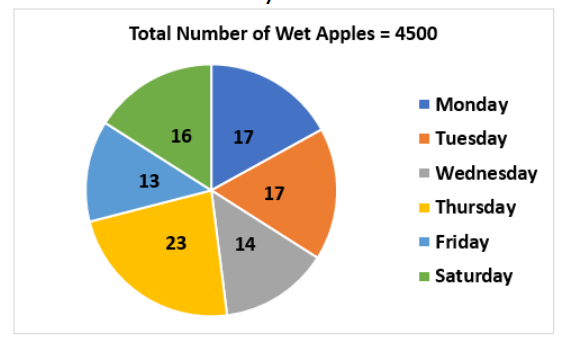
If the Apples (dry) sold on Sunday is 60 % more than the Apples (dry) sold on Saturday. Find the total Apples (dry) sold on Sunday and Saturday together?
View Solution
Knowledge Check
The following pie chart shows the hourly distribution of all the major activities of a student.
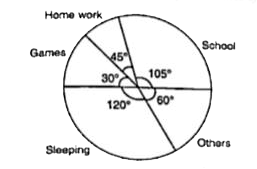
What is the difference in time (in hours) spends in school and in home work :A2B3C4D8The following pie chart shows the hourly distribution of all the major activities of a student.
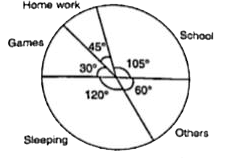
How much time (in per cent) he spends in games in comparison to sleeping ?A30%B40%C25%Dnone of theseThe following pie chart shows the hourly distribution of all the major activities of a student.
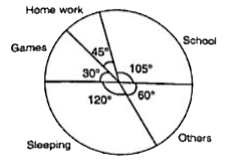
If he spends the time in games equal to the home work and remains constant in other activities, then the percentage decrease in time of sleeping :A0.15B12.5%C20%Dnone of these
Reading of pie chart for the % wise distribution of lectures in different subjects
View SolutionDirection: Study the following information carefully and answer the given questions: The following pie chart shows the percentage distribution of total number of Apples (Dry +dry)

The pie chart2 shows the percentage distribution of total number of Apples (Wet) sold in different days of a week.
What percentage of dry apples sold on Monday and Tuesday together?
View SolutionThe following pie chart shows the hourly distribution of all the major activities of a student.
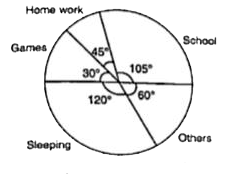
If he spends 13 rd time of home work in Mathematics then the no. of hours spends in rest of the subjects in home work :
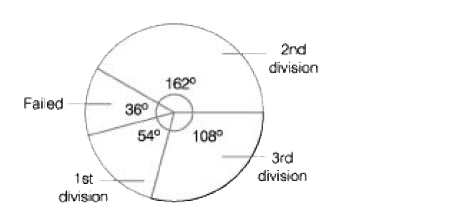
View SolutionThe following pie chart shows the performance in an examination in a particular year for 360 students. The percentage of students who have failed in the examination is
View SolutionThe following pie-chart shows the study-time of different subjects of a student in a day. Study the pie-chart and answer the following questions
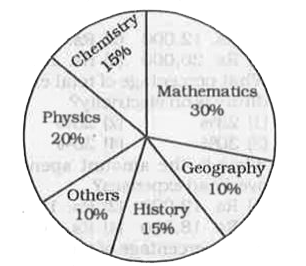
If the student studied chemistry for 3 hours, then he / she studied geography for
View Solution
